December Temperatures
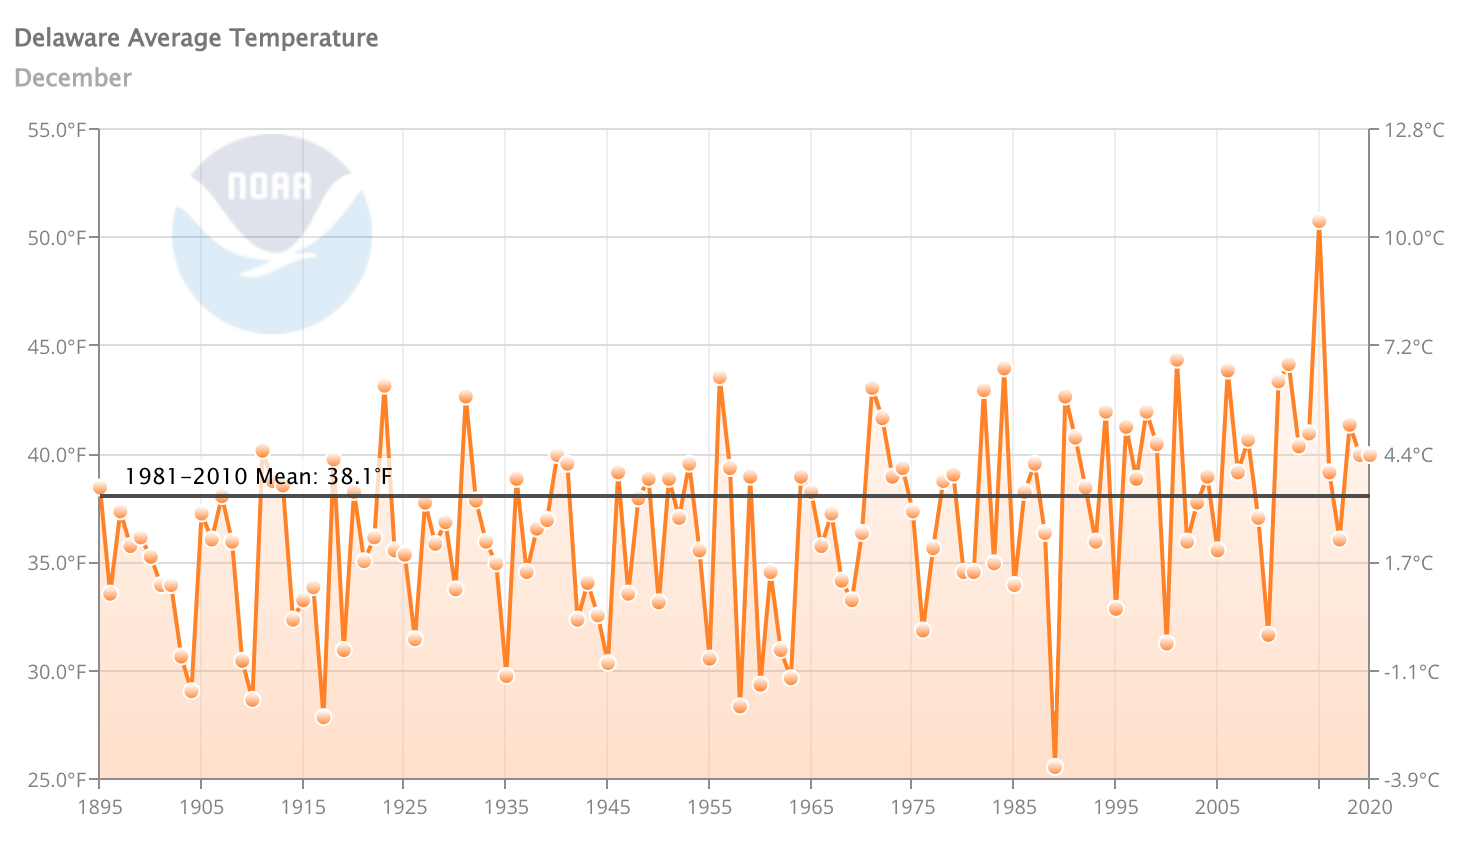
Preliminary data indicates that the statewide average temperature in December was 40.0o F, which is 1.9o F above the 1981-2010 mean value of 38.1o F (Figure 1). December 2020 was tied with two other years as the 24th warmest since observations began in 1895, placing it in the top one-third of all Decembers.
December Precipitation
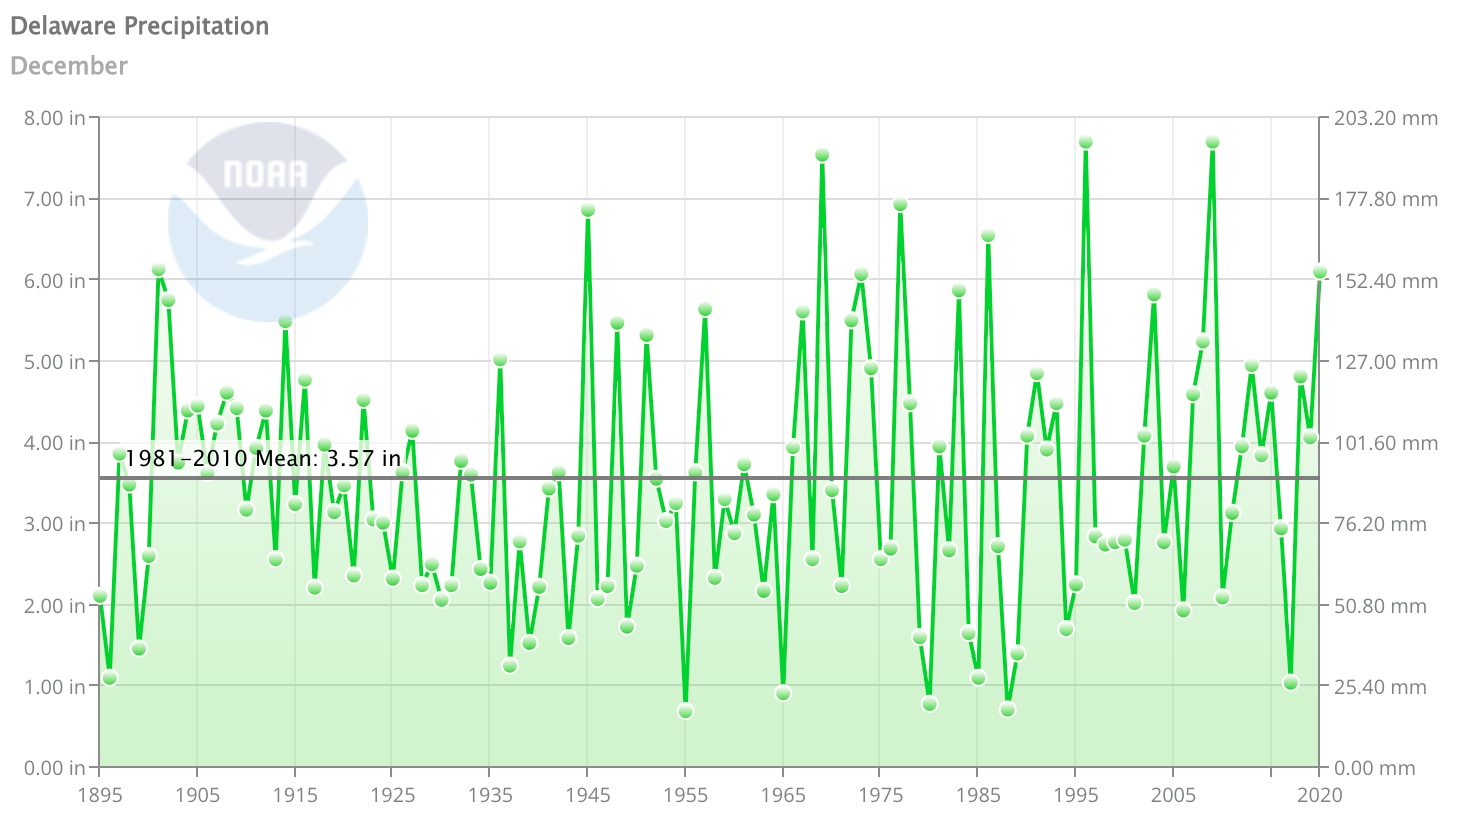
Delaware’s statewide precipitation for December 2020 averaged 6.11 inches, 2.54 inches above the 1981-2010 mean (Figure 2). This placed this month’s precipitation total as the 8th highest of all December’s since 1895.
Statewide Spatial Anomalies
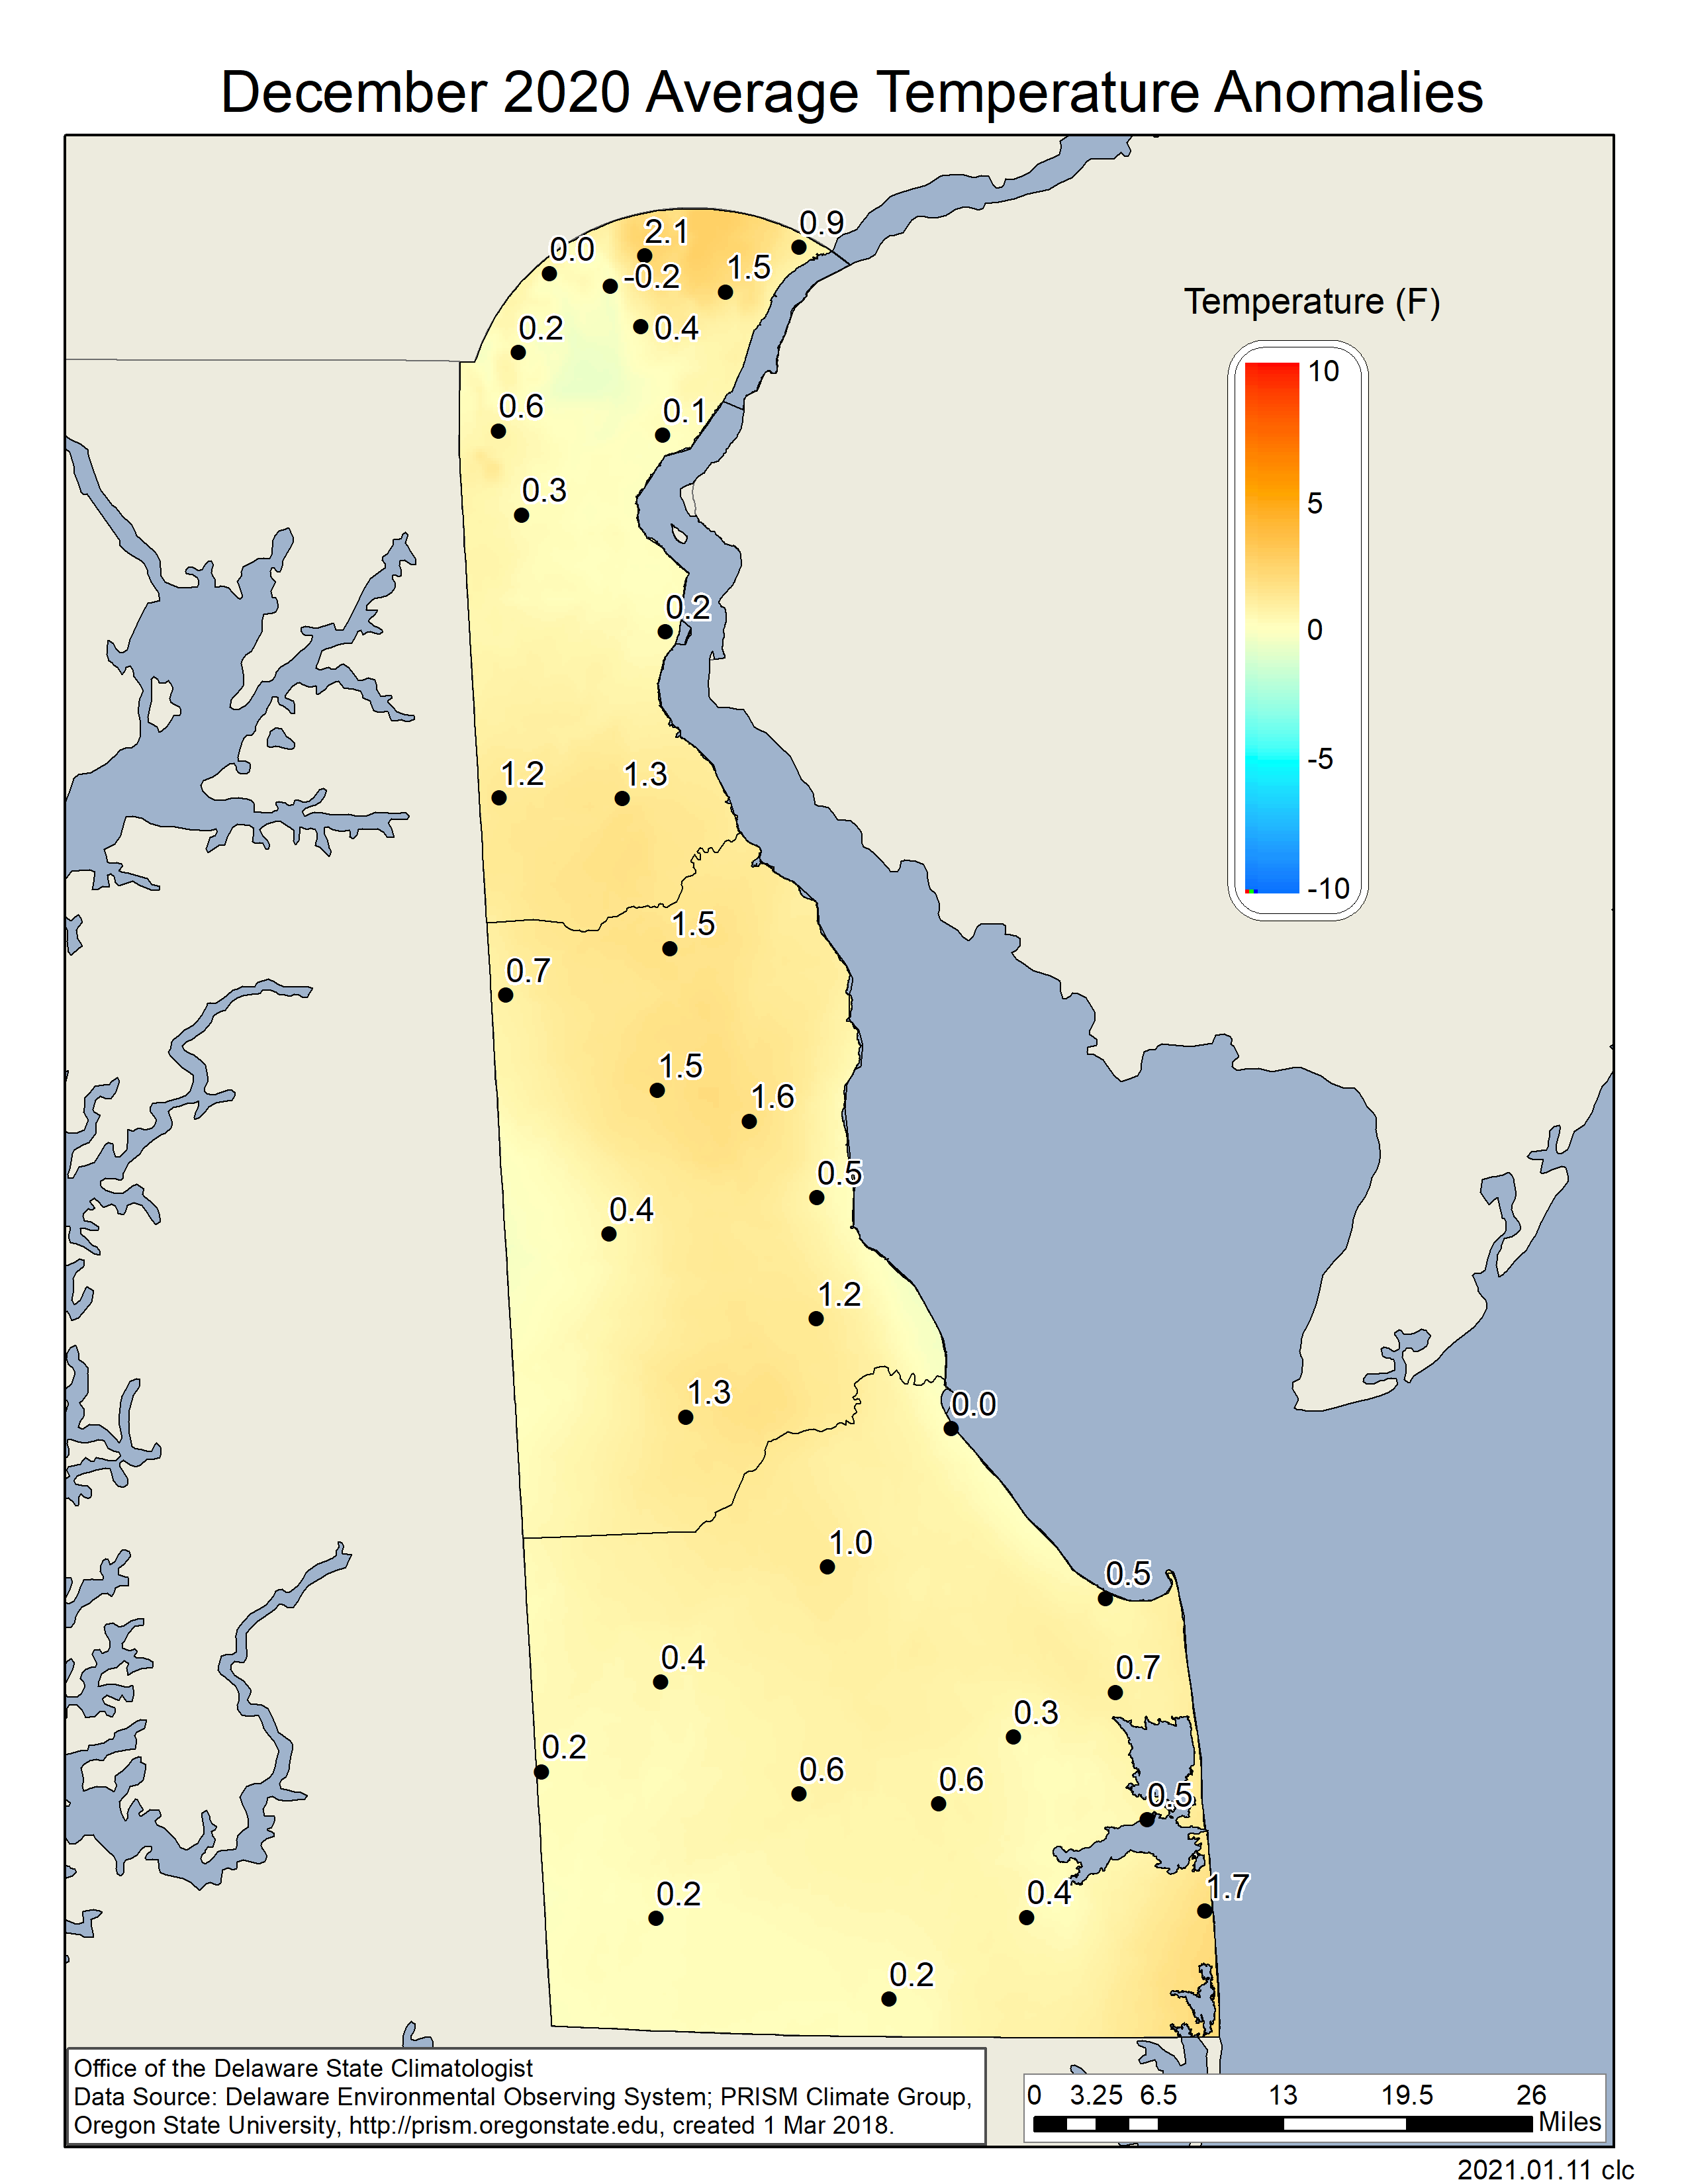
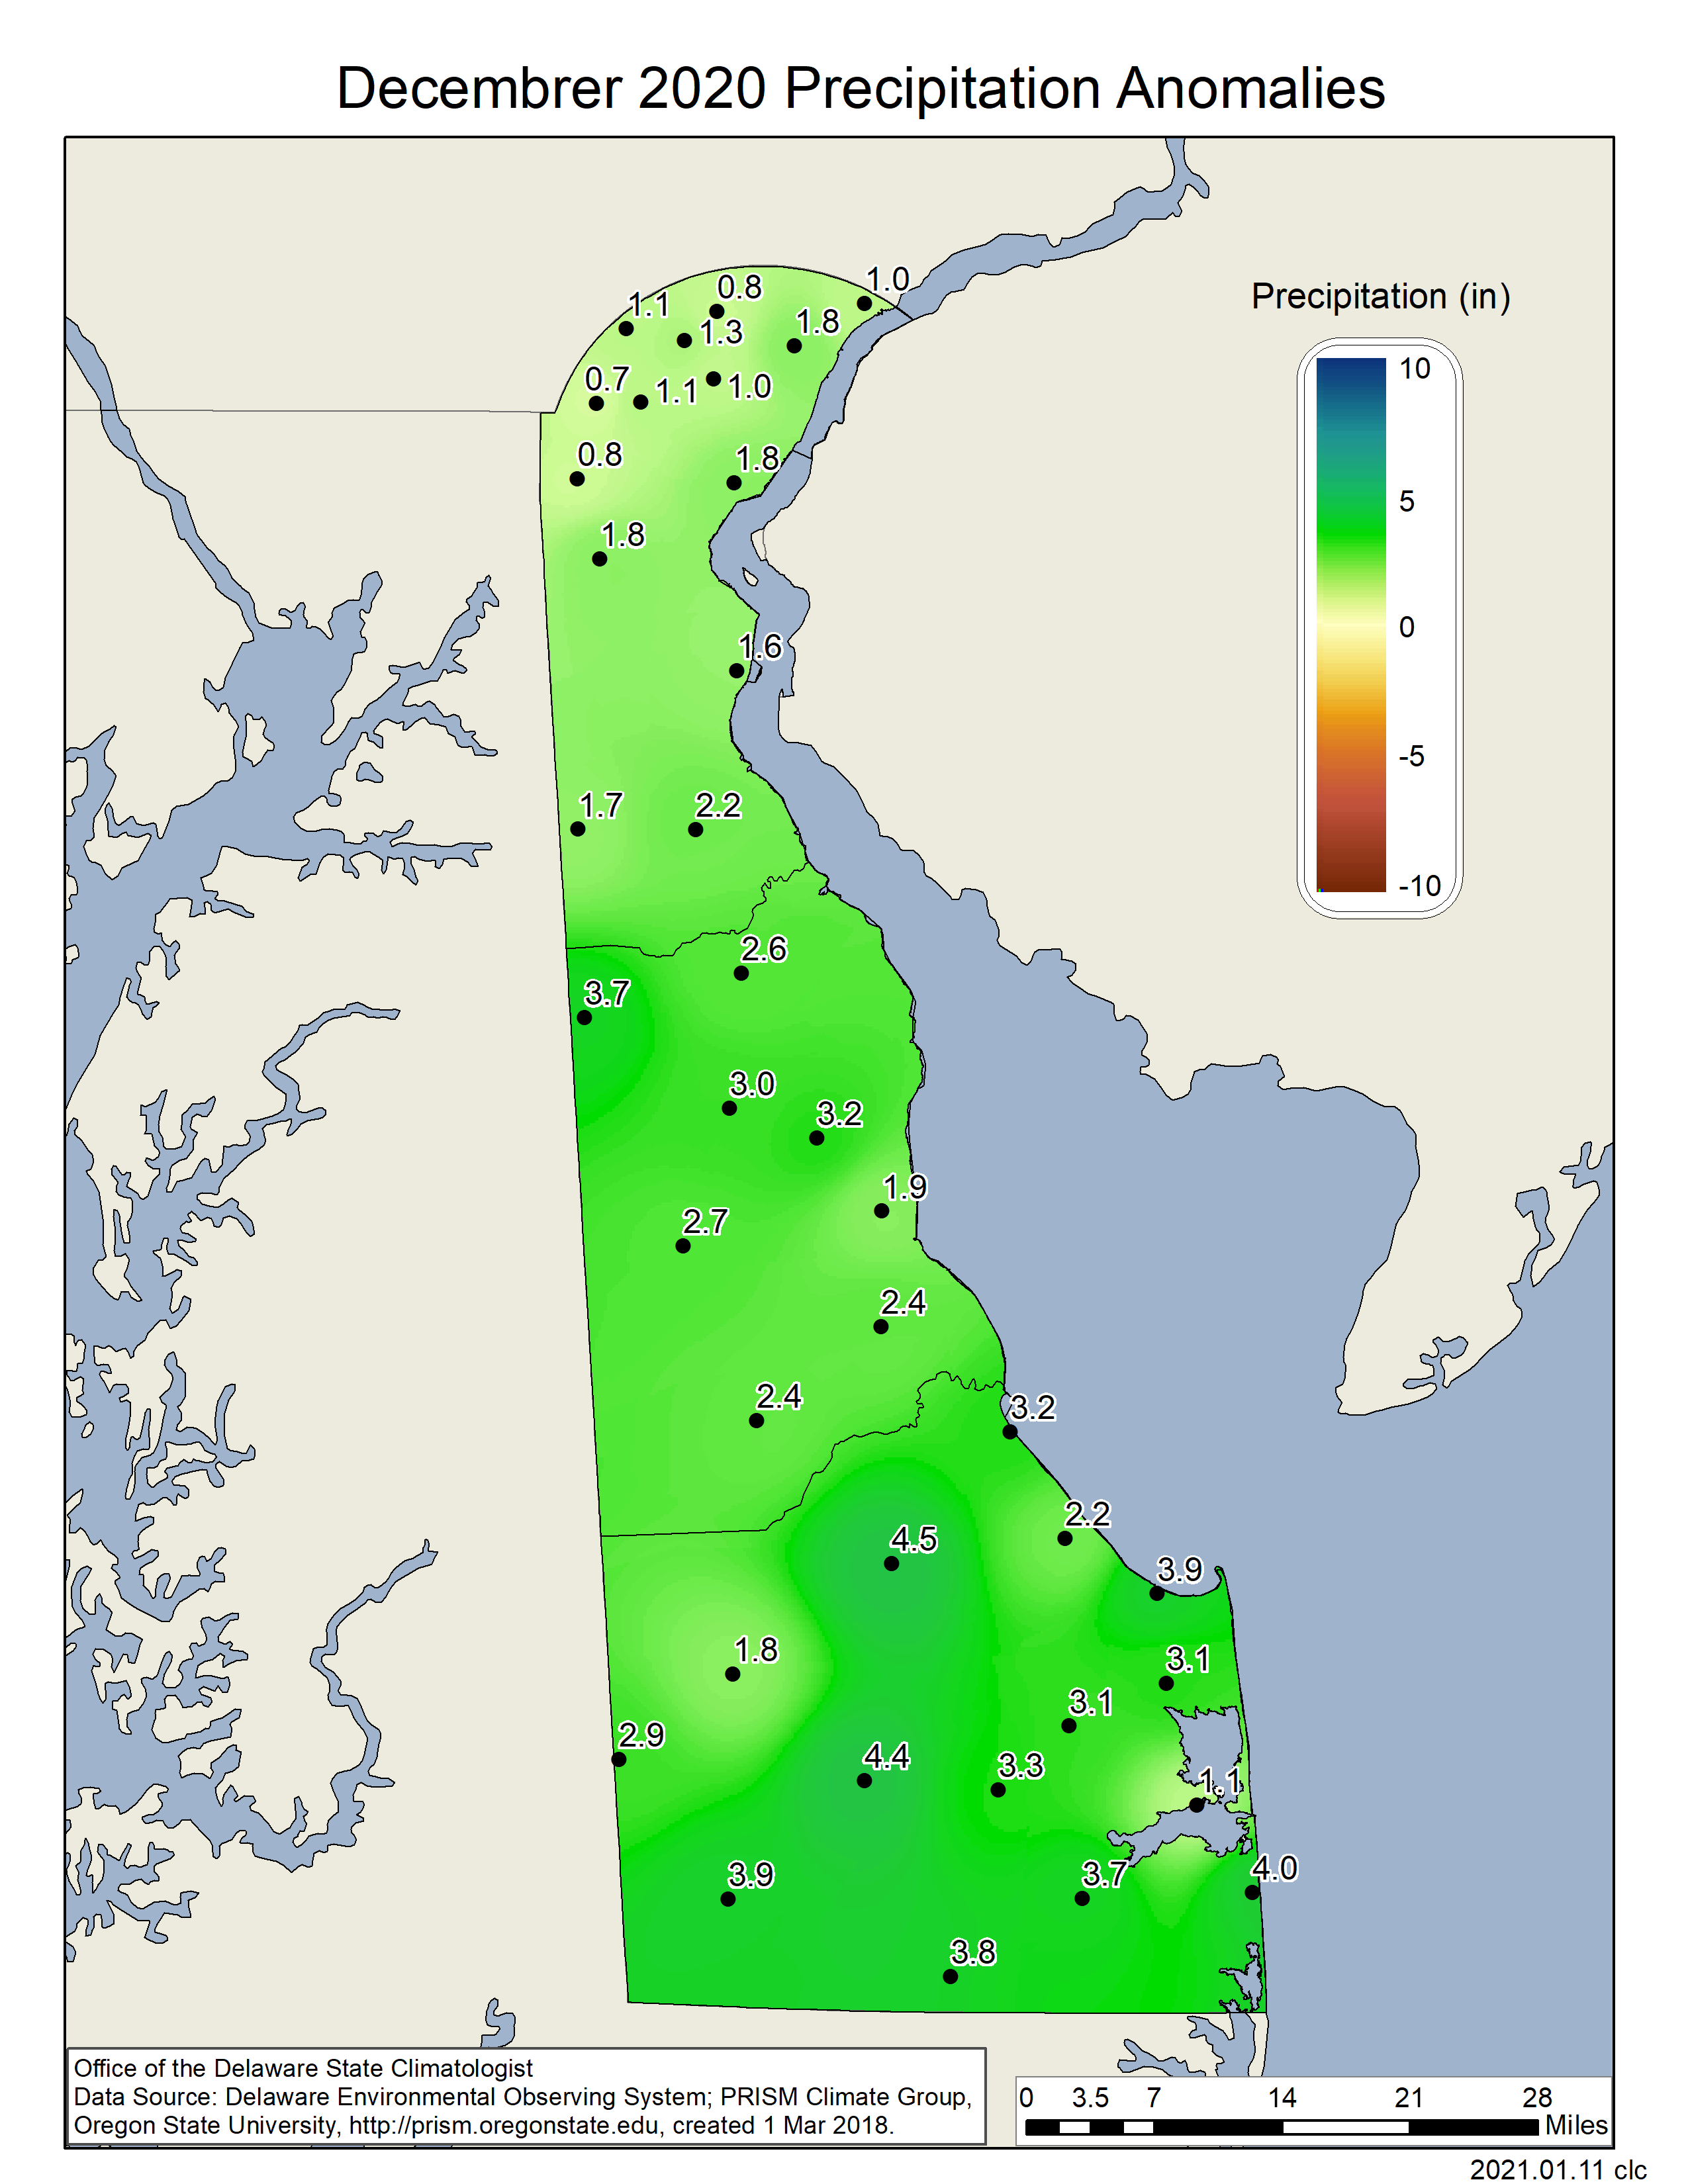
Data from the Delaware Environmental Observing System (DEOS) show that temperature departures were positive at nearly all stations, with the largest anomalies found across Kent and New Castle Counties (Figure 3). Precipitation was uniformly above normal throughout the State, with departures of greater than four inches in portions of Sussex County (Figure 4).
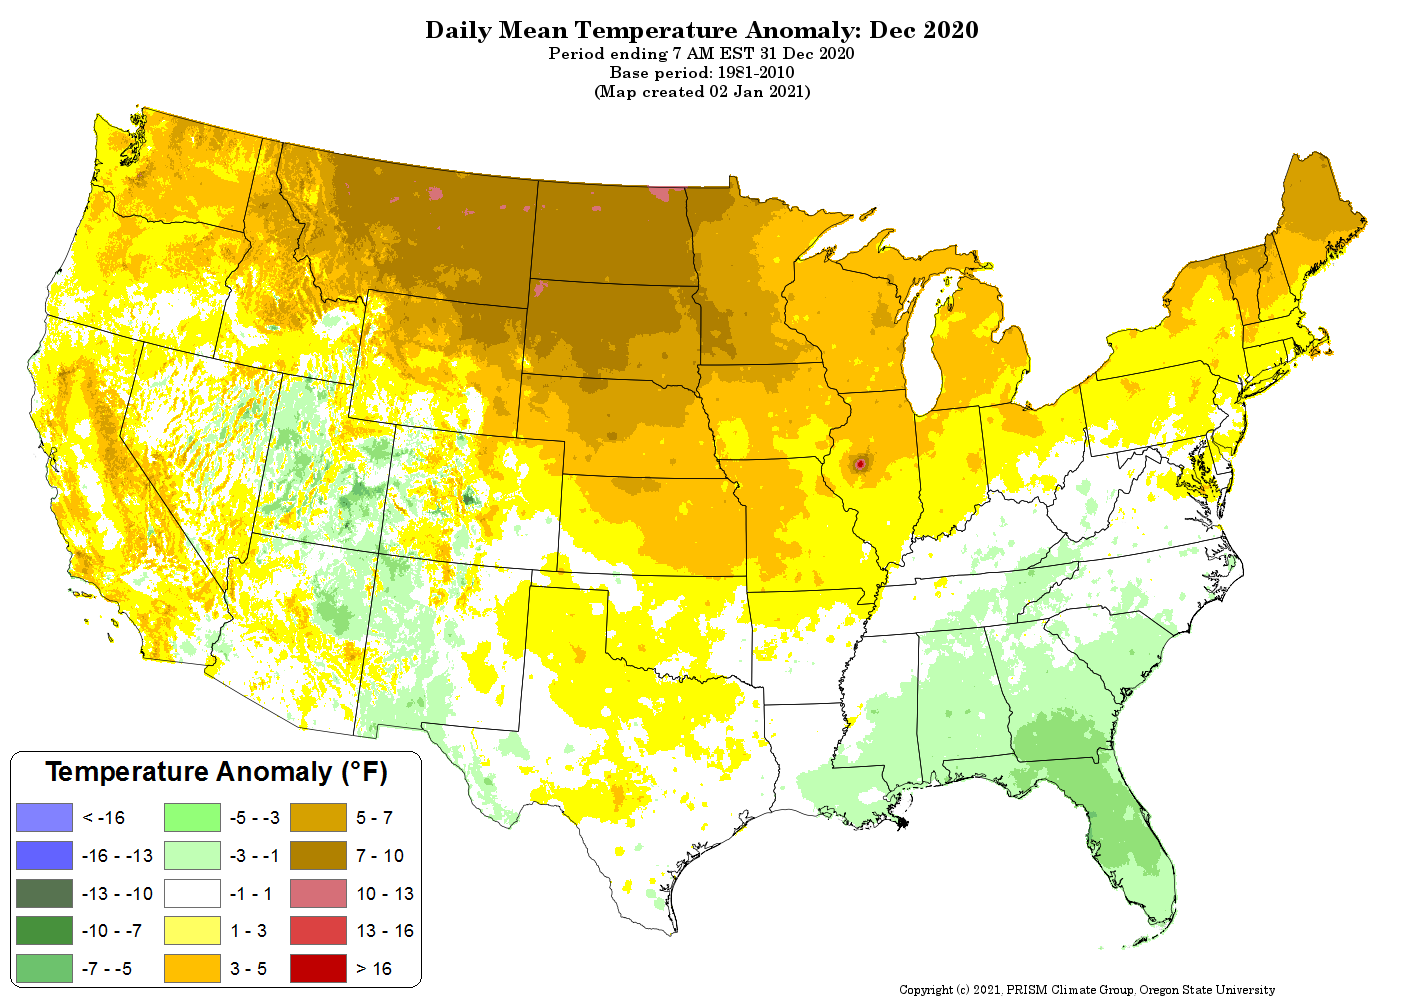
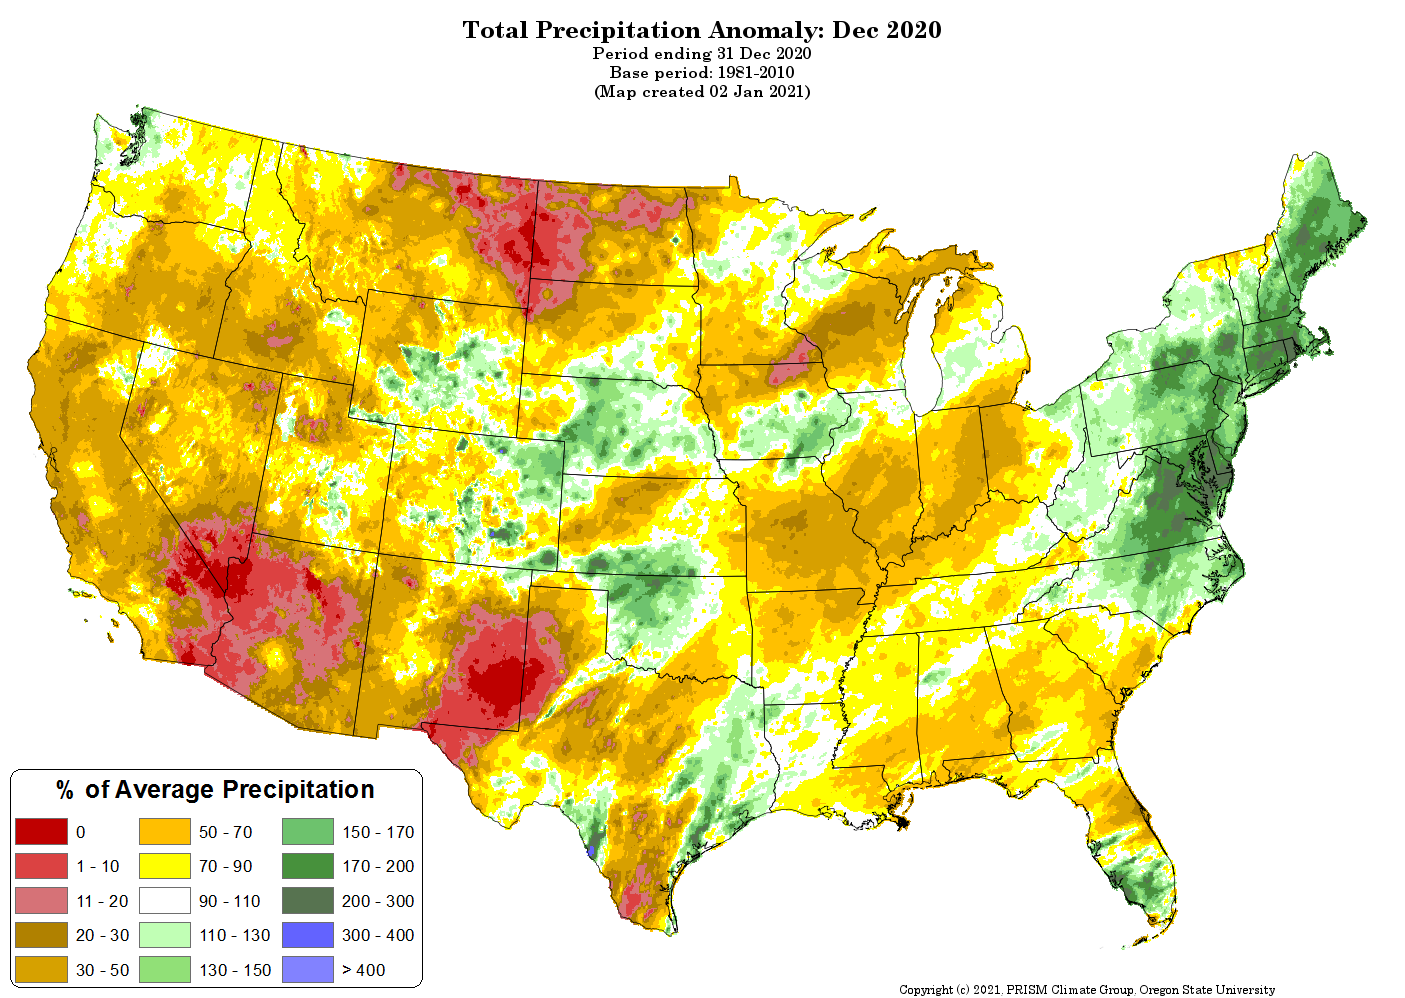
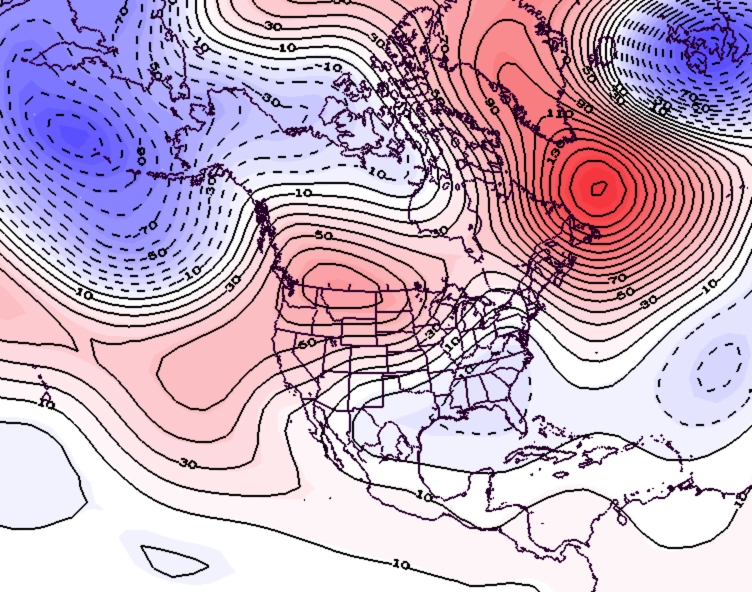
National Anomalies
Temperatures were above normal across the majority of the United States, with the largest temperature anomalies (5o F – 10o F) found across the north-central portion of the country (Figure 5). Only the southeastern United States saw below normal December temperatures. Precipitation anomalies varied greatly across the country with particularly heavy rainfall along the Atlantic coast from the Carolinas to Maine, while the Pacific coast saw very dry conditions (Figure 6). The 500 hPa height pattern for December shows a northerly displaced jet stream across the North American continent resulting in the warm conditions across the country (Figure 7).
Partners


