October Temperatures
Preliminary data indicates that the statewide average temperature in October was 61.3°F, which is 4.2°F above the 1981-2010 mean value of 57.1°F (Figure 1). This places October 2019 as the 8th warmest since records began in 1895.
October Precipitation
Delaware’s statewide precipitation for October 2019 averaged 4.38 inches, 0.92 inches above the 1981-2010 mean (Figure 2). This placed the October 2019 precipitation amount in the top one-third of months since 1895.
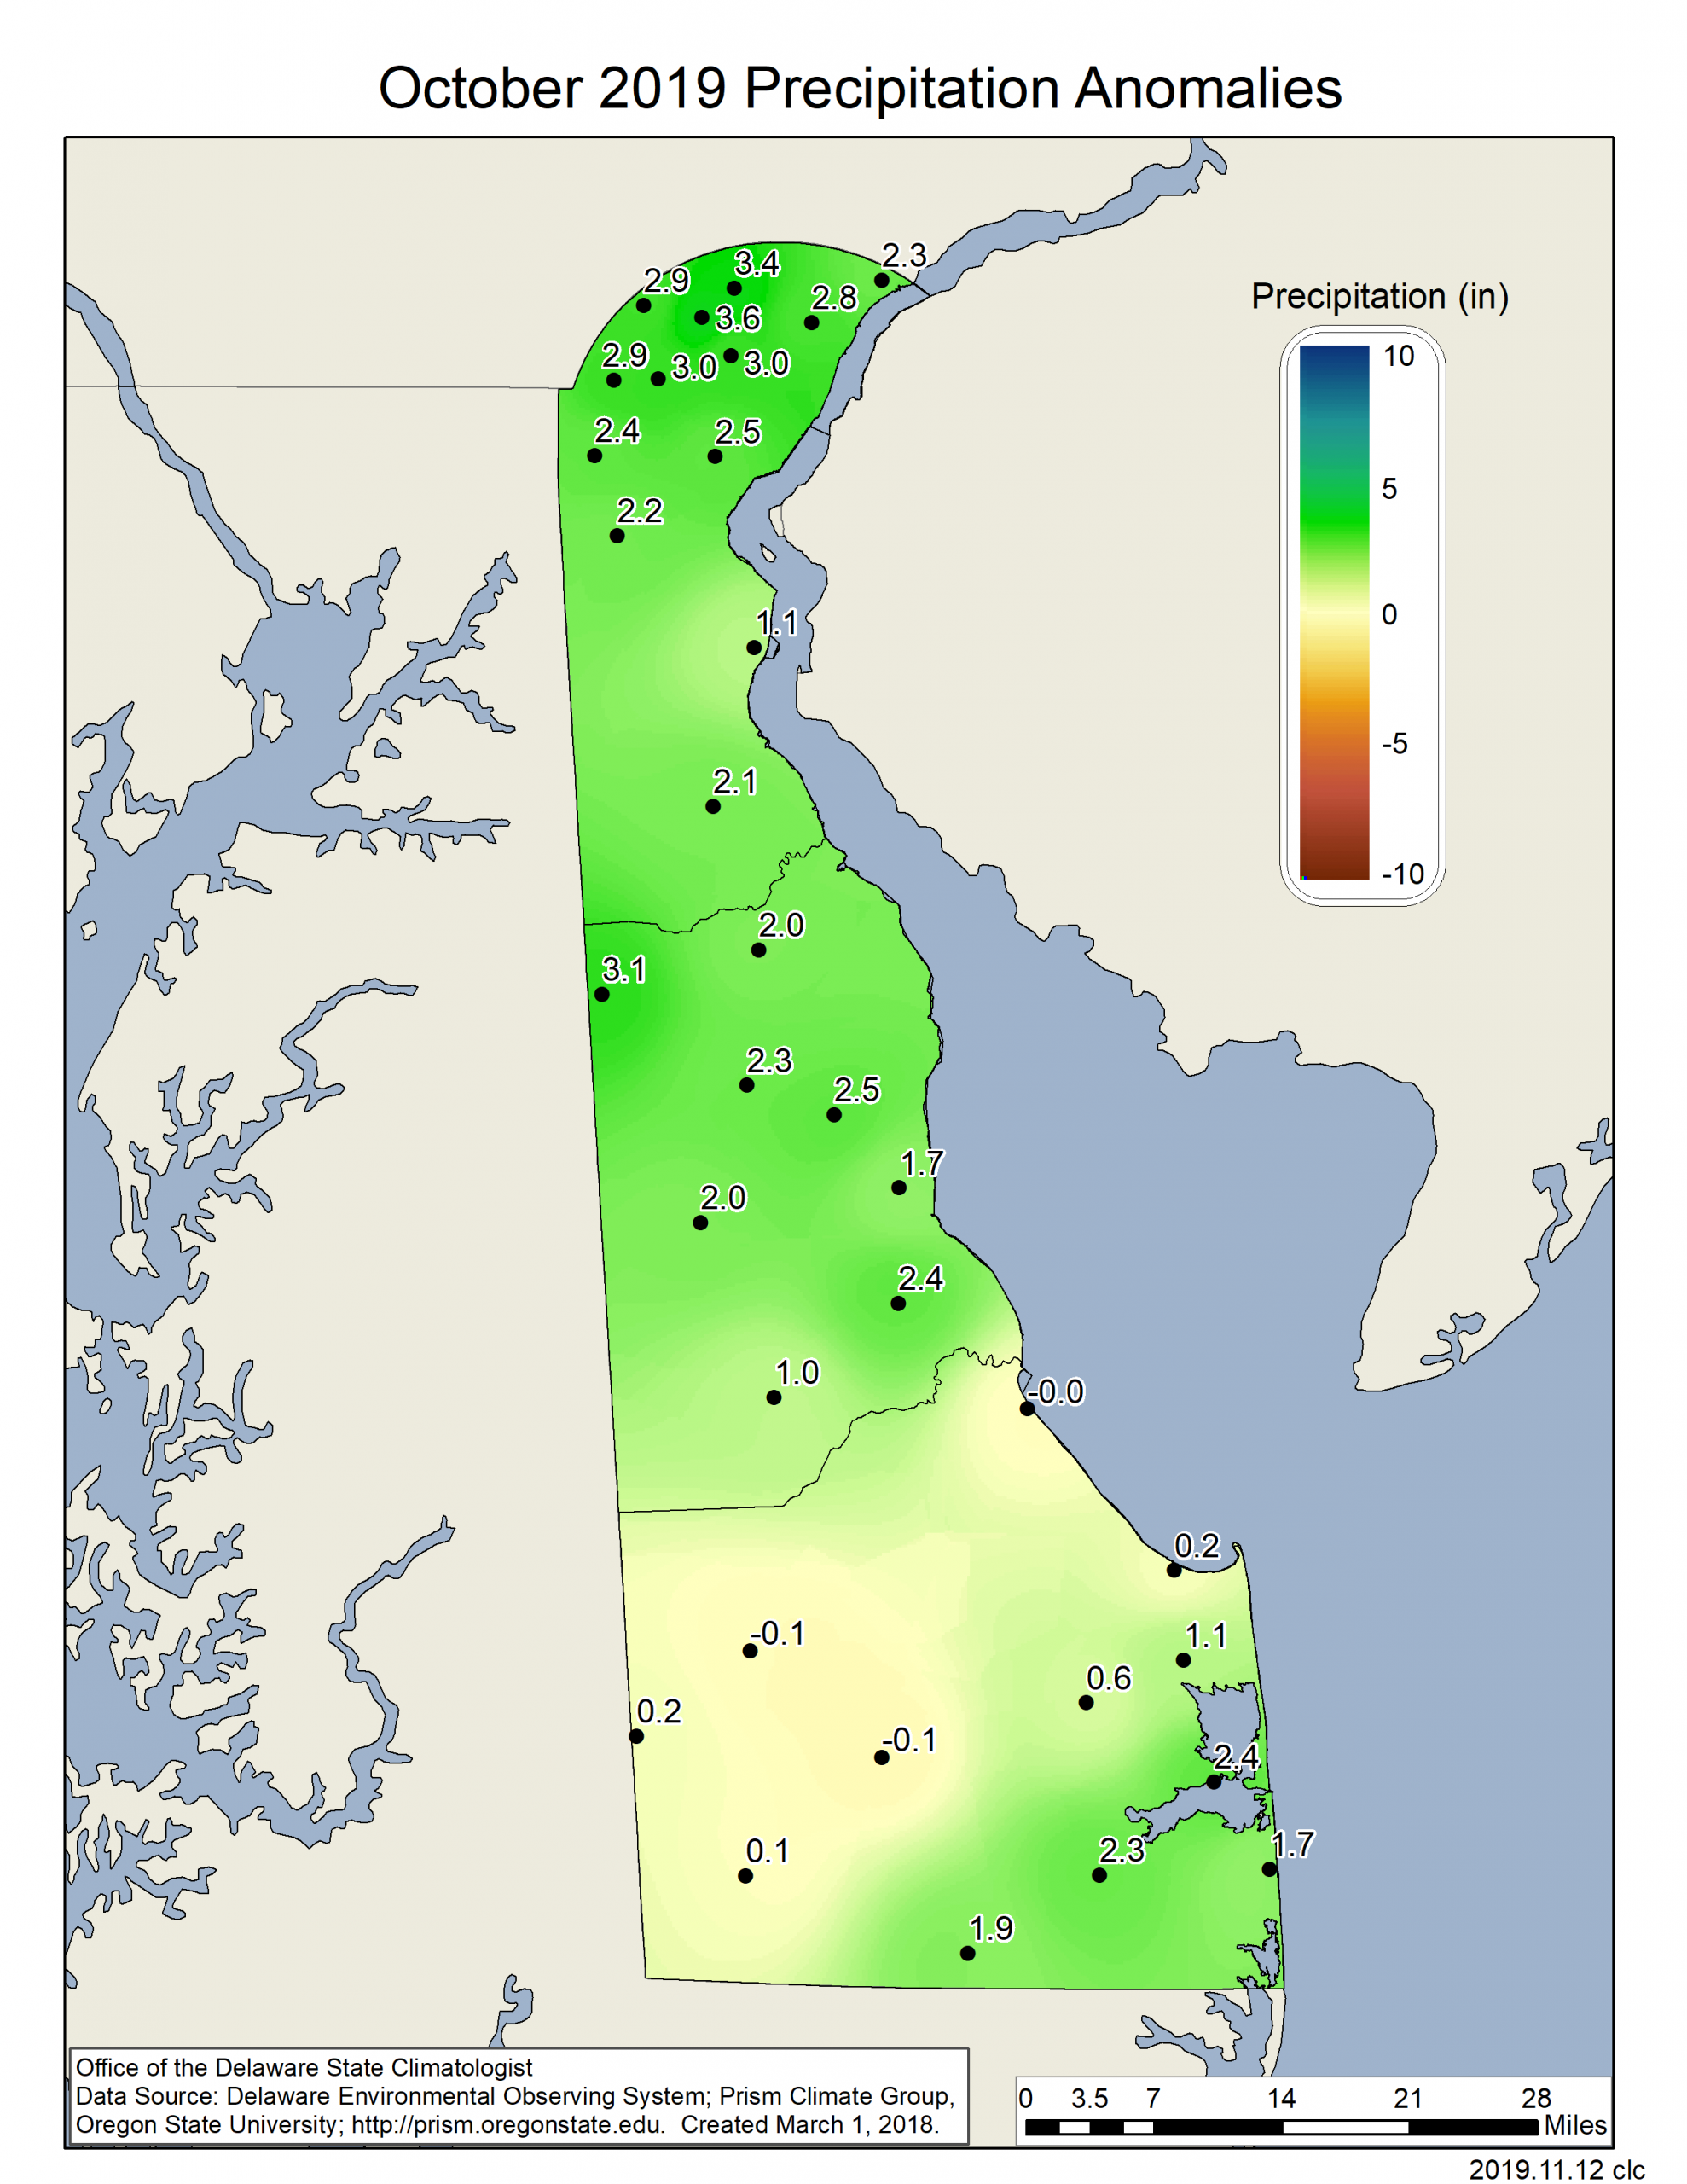
Statewide Spatial Anomalies
Data from the Delaware Environmental Observing System (DEOS) show that temperature departures were uniformly above normal throughout the State (Figure 3), with the largest positive anomalies found across northern New Castle County. Precipitation was above normal at all stations across New Castle and Kent Counties (Figure 4), with several stations in Sussex County recording near or just below normal precipitation for the month.
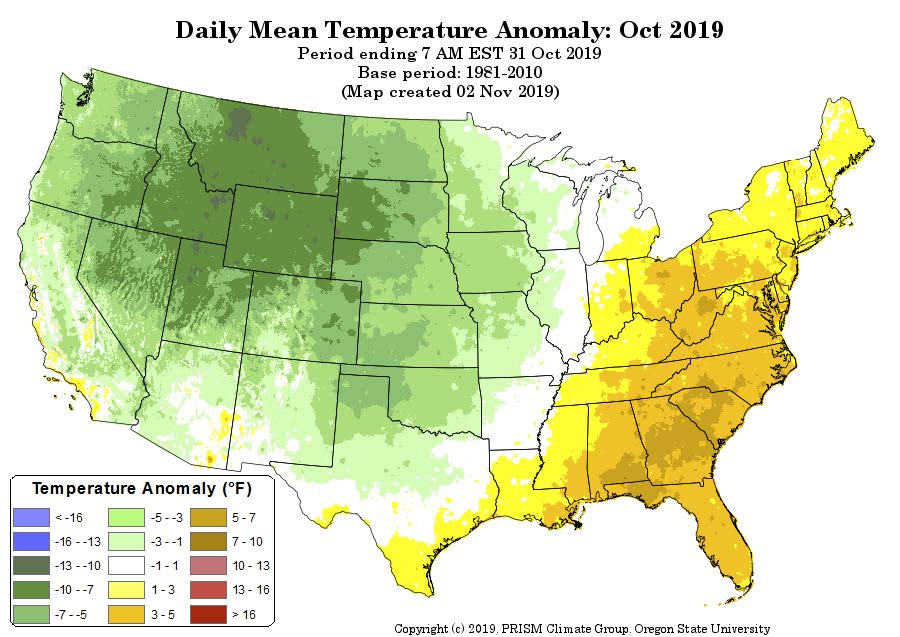
National Anomalies
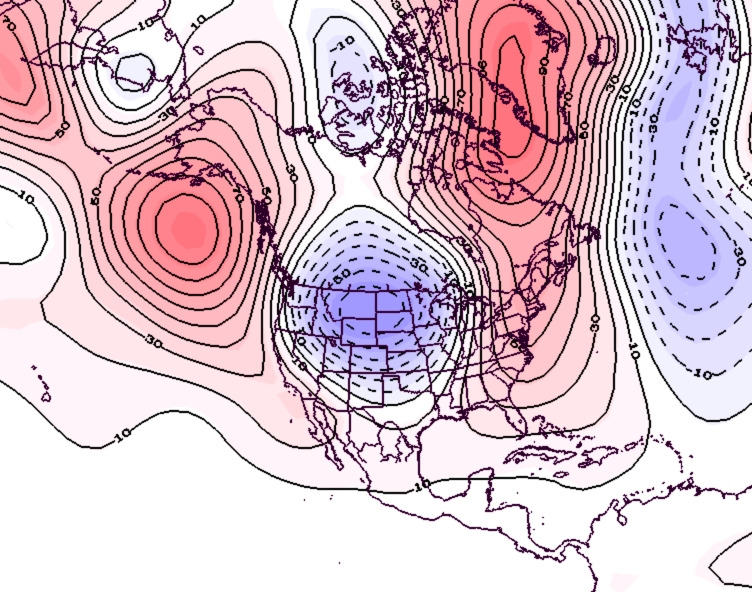
Temperatures were above normal throughout the eastern portion of the U.S, where some positive anomalies reached greater than 5°F (Figure 5). The western two-thirds of the U.S. saw below normal temperatures for the month, with some parts of the Rocky Mountains recording temperatures more than 10°F below normal. In general, precipitation was below normal across the western U.S. and above normal across the east (Figure 6). The 500 hPa height pattern for October showed a strong trough dominating the western U.S. (Figure 7), bringing the cold temperatures to that region.
-
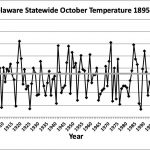
- Figure 1. Delaware statewide mean October temperature (°F) 1895-2019. Gray line indicates 1981-2010 normal.

-
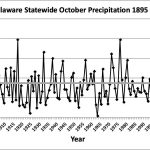
- Figure 2. Delaware statewide October precipitation (inches) 1895-2019. Gray line indicates 1981-2010 normal.

-
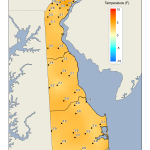
- Figure 3. October 2019 average temperature departures (°F) from the 1981-2010 mean based upon DEOS station data.

-
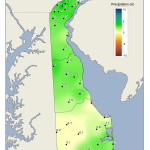
- Figure 4. October 2019 precipitation departures (inches) from the 1981-2010 mean based upon DEOS station data.
-
- Figure 5. National daily mean temperature anomalies for October 2019 (from the PRISM Climate Group, OSU).
-
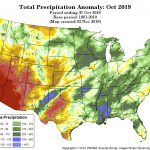
- Figure 6. Total Precipitation Anomaly for October 2019 (from the PRISM Climate Group, OSU).

-
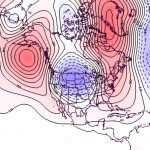
- Figure 7. 500 hPa geopotential height anomalies for October 2019. Negative (blue) anomalies indicate the presence of an anomalous jet stream trough while positive (red) height anomalies indicate the presence of anomalous ridging.
Similar Posts
Climate Office Partners


