All maps are courtesy of the High Plains Regional Climate Center ACIS Climate Maps application (https://hprcc.unl.edu/maps.php?map=ACISClimateMaps).
Temperature
Normal temperature is used to describe the average temperature that is expected at a certain time. In summer, the normal temperature is expected to be much higher than the normal temperature during the winter. Departure from normal temperature refers to how much the current temperature deviates from the expected normal temperature of a region. Determining which regions are experiencing the highest departure from normal temperature is important because it can be used as a proxy for climatologists, meteorologists, and other scientists to demonstrate the effect of a changing climate on a particular area.
NWS Eastern Region Departure from Normal Temperature
Last 7 days

Last 30 days

YTD

Precipitation
Normal precipitation is a term used to describe the average amount of precipitation an area receives during a certain time period. An example would be that during a dry season, the normal precipitation is much lower than that of a wet season in that same region. Departure from normal precipitation refers to how much precipitation differs than the normal precipitation. Determining when and where the precipitation differs from the normal in a region can help people access risks to that environment due to both increases and decreases in precipitation.
NWS Eastern Region Departure from Normal Precipitation
Last 7 days

Last 30 days

YTD

Standardized Precipitation Index (SPI)
NOAA defines SPI as “The Standardized Precipitation Index (SPI), one of several drought indices that have been developed over the decades, measures water supply, specifically precipitation” (Source: Did You Know?| Standardized Precipitation Index). The SPI is typically computed over periods of one to twenty-four months, to evaluate short-term and long-term precipitation excesses or droughts. An example of its use is the U.S. Drought Monitor, which uses information from SPI and other indices to depict drought.
NWS Eastern Region Standardized Precipitation Index (SPI)
Last 30 days

Last 90 days

Last 6 Months

Heating Degree Days (HDD) Base 65
What is a degree day?
Degree days are measures of how cold or warm a location is. A degree day compares the mean (the average of the high and low) outdoor temperatures recorded for a location to a standard temperature, usually 65° Fahrenheit (F) in the United States. The more extreme the outside temperature, the higher the number of degree days. A high number of degree days generally results in higher levels of energy use for space heating or cooling. Heating degree days (HDD) are a measure of how cold the temperature was on a given day or during a period of days. For example, a day with a mean temperature of 40°F has 25 HDD. Two such cold days in a row have a total of 50 HDD for the two-day period.
1991-2020 NCEI HDD Normals for Wilmington, DE (station id: 13781)
| Jan | Feb | Mar | Apr | May | Jun | Jul | Aug | Sep | Oct | Nov | Dec | Annual |
| 976 | 824 | 676 | 347 | 122 | 13 | 0 | 1 | 38 | 266 | 551 | 832 | 4646 |
NWS Eastern Region HDD
Last Full Month

Last Full Month Departure

Cooling Degree Days (CDD) Base 65
What is a degree day?
Degree days are measures of how cold or warm a location is. A degree day compares the mean (the average of the high and low) outdoor temperatures recorded for a location to a standard temperature, usually 65° Fahrenheit (F) in the United States. The more extreme the outside temperature, the higher the number of degree days. A high number of degree days generally results in higher levels of energy use for space heating or cooling. Cooling degree days (CDD) are a measure of how hot the temperature was on a given day or during a period of days. A day with a mean temperature of 80°F has 15 CDD. If the next day has a mean temperature of 83°F, it has 18 CDD. The total CDD for the two days is 33 CDD.
1991-2020 NCEI CDD Normals for Wilmington, DE (station id: 13781)
| Jan | Feb | Mar | Apr | May | Jun | Jul | Aug | Sep | Oct | Nov | Dec | Annual |
| 0 | 0 | 1 | 12 | 74 | 241 | 389 | 334 | 155 | 22 | 0 | 0 | 1228 |
NWS Eastern Region CDD
Last Full Month

Last Full Month Departure

Drought
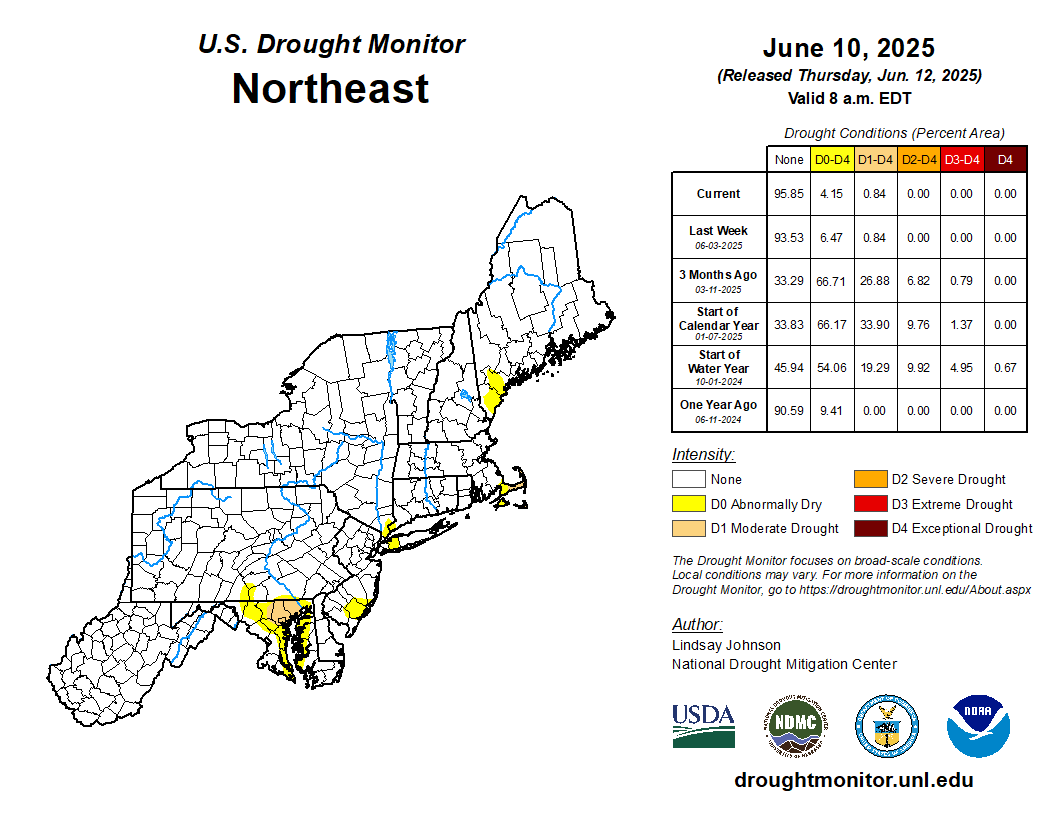
Delaware experiences both short-term and long-term droughts, which have direct impacts on water supply and availability, especially with regard to agriculture and irrigation. Below are the most current maps created by the US Drought Monitor (USDM). These maps will indicate the current drought using five classifications: abnormally dry (D0), showing areas that may be going into or are coming out of drought, and four levels of drought: moderate (D1), severe (D2), extreme (D3) and exceptional (D4).
For more detailed information on Delaware drought, please visit click here the US Drought Portal [drought.gov].
NWS Northeast Region Drought
For questions or comments about these maps or other data, please contact us.
Climate Office Partners


