The State of Delaware lies along the Atlantic coast of the United States, occupying the northern two-thirds of the Delmarva Peninsula. It is the second smallest of the United States with a land area of 1,982 mi². It is surrounded by water bodies including the Atlantic Ocean and Delaware Bay to the east, and Chesapeake Bay to the west.
The State is situated in a transition zone between humid subtropical climate conditions to the south and humid continental conditions to the north. The moderating effects of the surrounding water bodies lessen temperature extremes compared to nearby interior locations. Even so, the State has a continental climate, with cold winter temperatures, hot summers and ample precipitation throughout the year. However, annual precipitation amounts can vary greatly from one year to another.
Temperatures

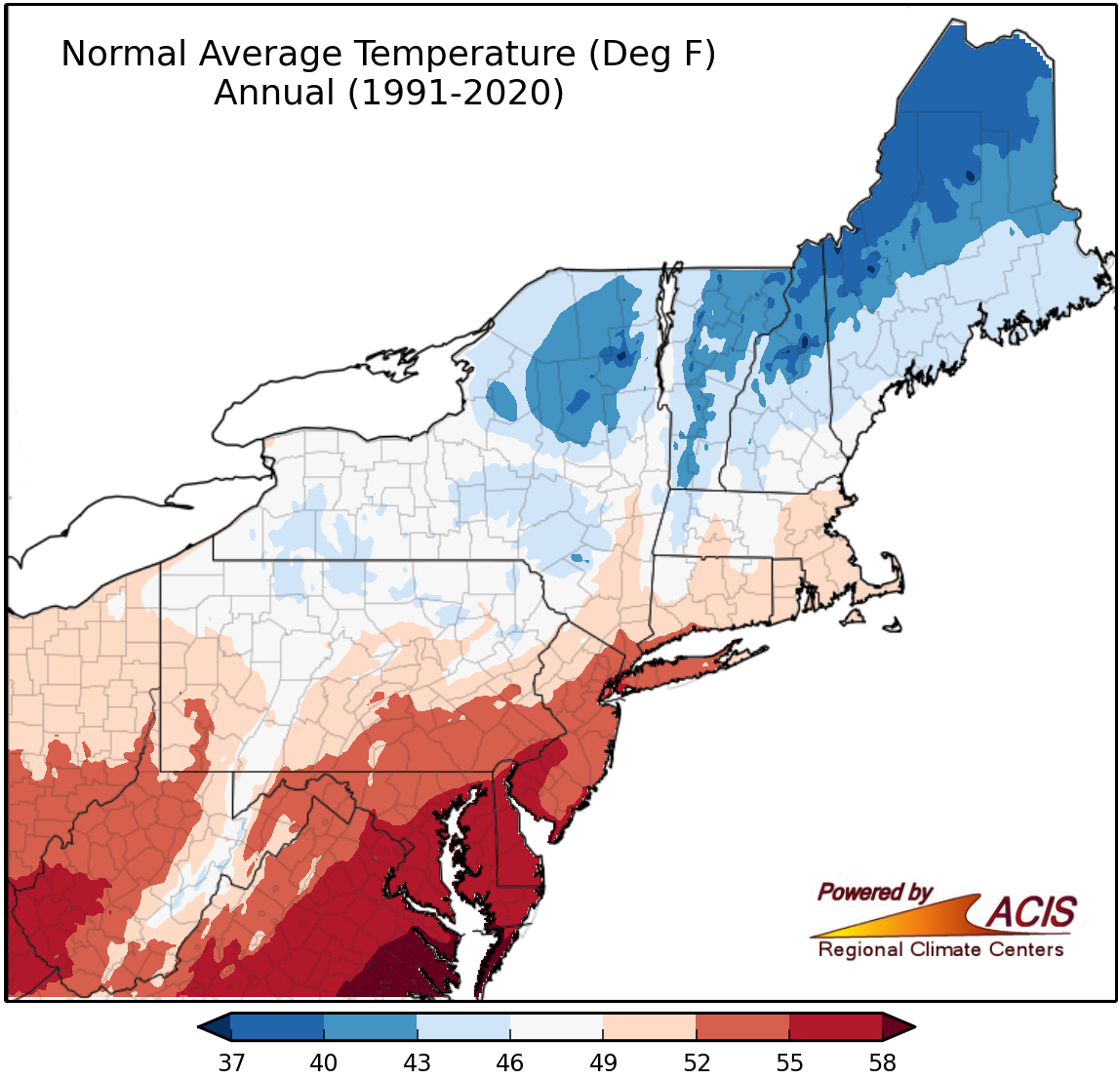
Mean annual temperatures across the State range from 54.0 °F in northern New Castle County to 58.1 °F along the Atlantic coast of southern Delaware. There has been a noticeable increase in mean annual temperatures since approximately 1980.
Precipitation and Storms
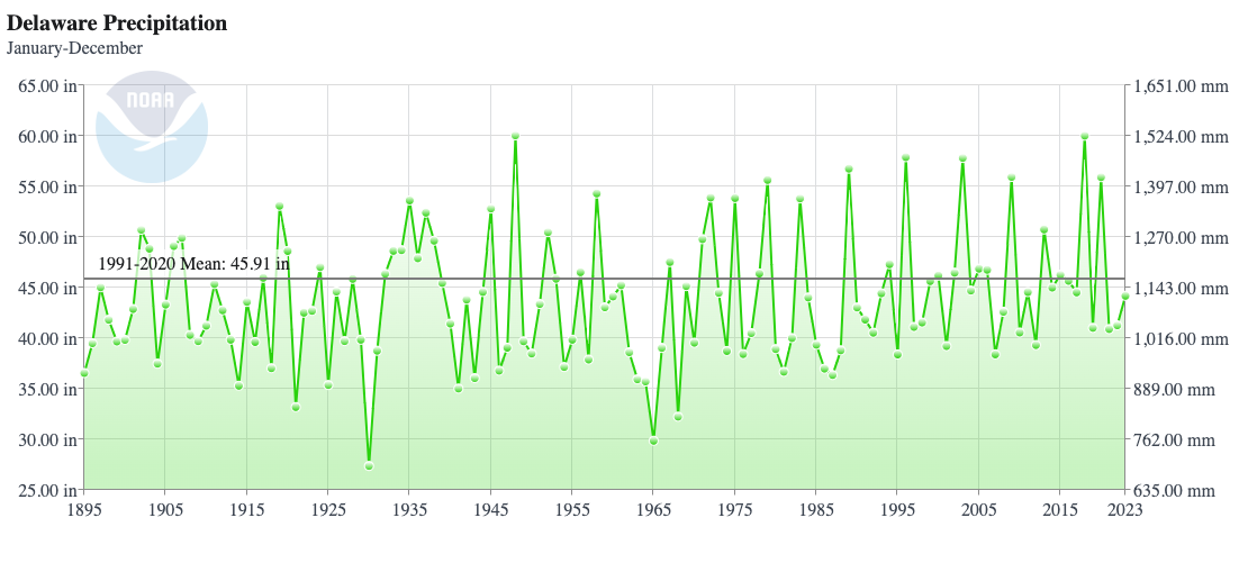
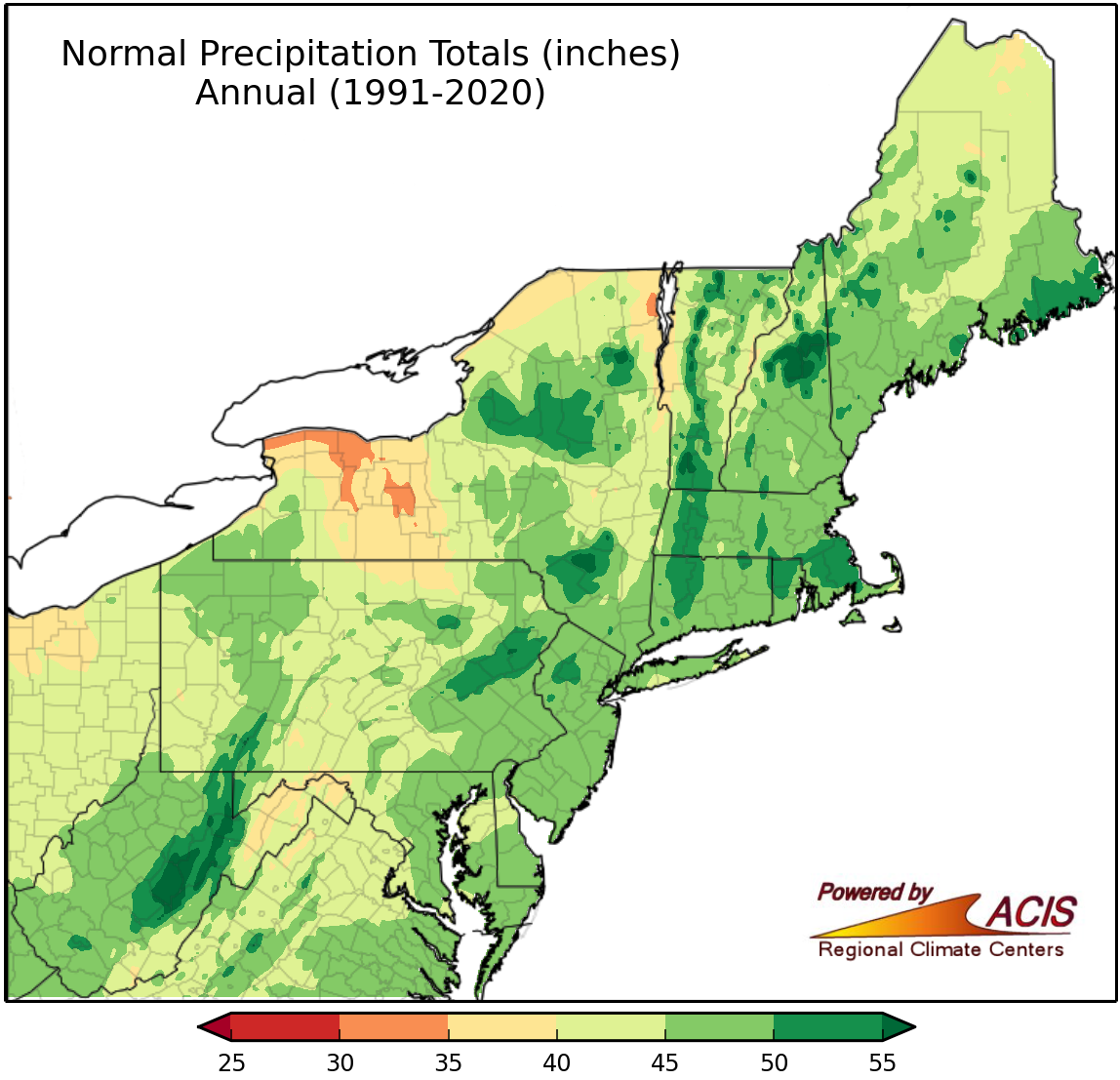
Mean annual precipitation for Delaware is about 45 inches with large inter-annual variability.
The State is often affected by seasonally occurring severe weather including winter and spring nor-easters that can drop heavy snow or rain, autumn tropical systems, spring and summer severe thunderstorms, and other coastal flooding events.
Delaware Climate Normals
Delaware’s climate experiences significant variations, with cold winter temperatures, hot summer temperatures, and varying amounts of precipitation. On average, the state has both moderate temperatures and a moderate amount of precipitation each year when compared to the surrounding states. Rising temperatures and increasing moisture content of the atmosphere may continue to impact the normal climate of Delaware and various types of severe weather across the State. For more information about Delaware’s climate, go to Delaware’s Climate StoryMap.
All-Time Climate Extremes for DE
| Variable | Value | Location | Date | Station ID | Status |
|---|---|---|---|---|---|
| Rainfall | |||||
| 24-hr Precipitation | 12.48 in. | Harbeson | September 28-29,2016 | DWAR* | NSA |
| Snowfall | |||||
| 24-hr Snow Fall | 25.0 in. | Dover | February 19, 1979 | 072730 | E |
| Monthly Snowfall | 46.9 in. | Bear 2 SW | February 1-28, 2010 | 071200 | NSA |
| Seasonal Snowfall | 72.7 in. | Bear 2 SW | July 1, 2009 – June30, 2010 | 071200 | NSA |
| Snow Depth | 28 in. | Greenwood 2.9 SE | Feb 7, 2010 | CoCoRaHS DE-SS-7 | NSA |
| Temperature | |||||
| Maximum Temperature | 110 °F | Millsboro | July 21, 1930 | 076020 | E |
| Minimum Temperature | -17 °F | Millsboro | January 17, 1893 | 076020 | E |
Credit: NOAA Climate Services and Monitoring Division. For more information, please visit https://www.ncdc.noaa.gov/extremes/scec/records/de.
* This measurement was recorded at DEOS Mesonet Station DWAR (NWSLI WARD1)
Status Key for Each Extreme Climate Event
E – Value is unchanged from previous extremes tables last updated by NCDC between 1998 and 2006. Value exceeds all other valid values.
N – Value is changed from extremes tables last updated by NCDC between 1998 and 2006. Value exceeds all other valid values.
S – Value has been officially reviewed by a State Climate Extremes Committee.
A – Additional information is available. Official value may be exceeded by a widely accepted unofficial value that is not supported by a direct, calibrated observation (e.g., estimates, uncalibrated instruments, anecdotal reports).
1 – Value ties values from earlier dates.
Climate Office Partners


