Summer Temperatures
Preliminary data indicates that summer temperatures averaged 76.2°F during the summer season, 1.7°F above the 30-year “normal” of 74.5°F (Figure 1). Summer 2018 is tied with the summer of 2005 as the 6th warmest since records began in 1895.
Summer Precipitation
The statewide mean precipitation of 13.73 inches was 1.73 inches above the 1981-2010 normal of 12.0 inches. (Figure 2). This value placed the summer of 2018 in the “normal” range for precipitation since 1895.
Statewide Spatial Averages
Data from the Delaware Environmental Observing System (DEOS) show that summer temperature anomalies across the State were generally above normal, except for extreme western portions of Kent County (Figure 3). Summer precipitation totals varied greatly with location across the State (Figure 4). In general, stations in New Castle and Kent counties saw above normal precipitation during the summer season, while coastal areas of Sussex County saw significant precipitation deficits.
-
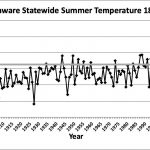
- Figure 1. Delaware statewide mean summer temperature (°F) 2018. Gray line indicates 1981-2010 normal.
-
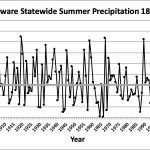
- Figure 2. Delaware statewide summer precipitation (inches) 1895-2018. Gray line indicates 1981-2010 normal.
-
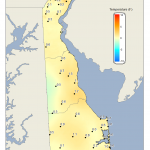
- Figure 3. summer 2018 average temperature departures (°F) from the 1981-2010 mean based upon DEOS station data.
-
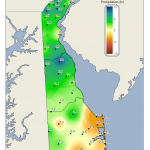
- Figure 4. summer 2018 precipitation departures (inches) from the 1981-2010 mean based upon DEOS station data.
Similar Posts
- July 2025 – Very Warm with Above Normal Precipitation Across Delaware (2025)
- June 2025 – Very Warm with Below Normal Precipitation Across Delaware (2025)
- July 2024 – Warm with Near Normal Precipitation (2024)
- June 2024 – Continued Warm with Near Normal Precipitation (2024)
- July 2023 – Warm with Above Normal Precipitation Across Delaware (2023)
Climate Office Partners


