December Temperatures
Preliminary data indicates that the statewide average temperature in December was 40.2°F, which is 2.1°F above the 1981-2010 mean value of 38.1°F (Figure 1). This places December 2019 as the 23rd warmest since records began in 1895.
December Precipitation
Delaware’s statewide precipitation for December 2019 averaged 4.26 inches, 0.69 inches above the 1981-2010 mean (Figure 2). This placed the December 2019 precipitation amount in the top one-third of months since 1895.
Statewide Spatial Anomalies
Data from the Delaware Environmental Observing System (DEOS) show that temperature departures were uniformly above normal throughout the State (Figure 3), with most anomalies ranging from 1° to 2° F. Precipitation was above normal at all stations across the State (Figure 4), except for the extreme southeast. The largest positive precipitation departures were found across northern New Castle County.
National Anomalies
Temperatures were above normal throughout the majority of the U.S, with some departures reaching 7° to 10° F in the Midwest (Figure 5). Precipitation varied greatly across the U.S. with very wet conditions across the northcentral States and much of the eastern one-third of the country (Figure 6). The 500 hPa height pattern for December showed a ridge dominating the northeastern two-thirds of the U.S. (Figure 7), bringing generally warm and moist conditions to our region.
-
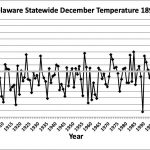
- Figure 1. Delaware statewide mean December temperature (°F) 1895-2019. Gray line indicates 1981-2010 normal.
-
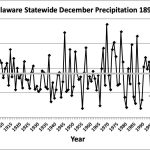
- Figure 2. Delaware statewide December precipitation (inches) 1895-2019. Gray line indicates 1981-2010 normal.
-
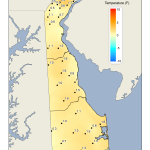
- Figure 3. December 2019 average temperature departures (°F) from the 1981-2010 mean based upon DEOS station data.
-
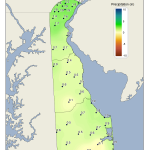
- Figure 4. December 2019 precipitation departures (inches) from the 1981-2010 mean based upon DEOS station data.
-
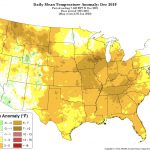
- Figure 5. National daily mean temperature anomalies for December 2019 (from the PRISM Climate Group, OSU).
-
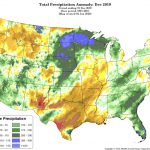
- Figure 6. Total Precipitation Anomaly for December 2019 (from the PRISM Climate Group, OSU).
-
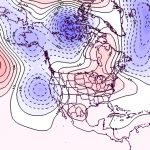
- Figure 7. 500 hPa geopotential height anomalies for December 2019. Negative (blue) anomalies indicate the presence of an anomalous jet stream trough while positive (red) height anomalies indicate the presence of anomalous ridging.
Similar Posts
- December 2025 – Cold and Dry Across Delaware (2026)
- December 2024 – Cool and Dry Across Delaware (2025)
- Winter 2023-2024 – Very Warm and Very Wet Across Delaware (2024)
- December 2023 – Very Warm with Record Precipitation (2024)
- December 2022 – Cool with Above Normal Precipitation Across Delaware (2023)
Climate Office Partners


