March Temperatures
Preliminary data indicates that the statewide average temperature in March was 49.8o F, which is 5.8o F above the 1981-2010 mean value of 44.0o F (Figure 1). March 2020 was the 4th warmest since 1895 in Delaware.
March Precipitation
Delaware’s statewide precipitation for March 2020 averaged 3.59 inches, 0.61 inches below the 1981-2010 mean (Figure 2). This placed the March 2020 precipitation amount in the “normal” category when compared to all years since 1895.
Statewide Spatial Anomalies
Data from the Delaware Environmental Observing System (DEOS) show that temperature departures were above normal throughout the State (Figure 3), with most stations more than 4o F above the 30-year mean. Precipitation was below normal at most locations, with the largest negative anomalies found in southern Sussex County (Figure 4).
National Anomalies
Temperatures were above normal across the eastern two-thirds of the U.S., with departures reaching 7o to 10o F along the Gulf Coast. Small negative temperature departures were found along the Pacific Coast of the country (Figure 5). Precipitation varied greatly across the U.S. with extremely wet conditions across the Southwest and dry conditions along the Gulf Coast (Figure 6). The 500 hPa height pattern for March showed a strong ridge dominating the eastern two-thirds of the country (Figure 7) leading to the warm temperatures across our region.
-
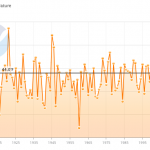
- Figure 1. Delaware statewide mean March temperature (oF) 1895-2020. Black line indicates 1981-2010 normal.
-
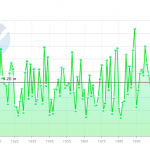
- Figure 2. Delaware statewide March precipitation (inches) 1895-2020. Black line indicates 1981-2010 normal.
-
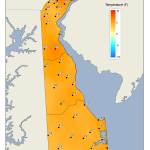
- Figure 3. March 2020 average temperature departures (oF) from the 1981-2010 mean based upon DEOS station data.
-
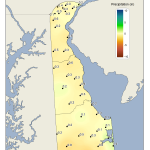
- Figure 4. March 2020 precipitation departures (inches) from the 1981-2010 mean based upon DEOS station data.
-
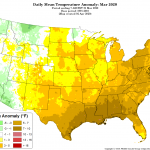
- Figure 5. National daily mean temperature anomalies for March 2020 (from the PRISM Climate Group, OSU).
-
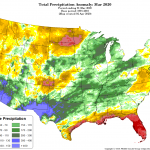
- Figure 6. Total Precipitation Anomaly for March 2020 (from the PRISM Climate Group, OSU).
-
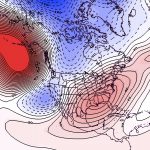
- Figure 7. 500 hPa geopotential height anomalies for March 2020. Negative (blue) anomalies indicate the presence of an anomalous jet stream trough while positive (red) height anomalies indicate the presence of an anomalous jet stream ridge.
Similar Posts
- March 2025 – Very Warm with Above Normal Precipitation Across Delaware (2025)
- March 2024 – Very Warm and Wet Across Delaware (2024)
- March 2023 – Warm with Much Below Normal Precipitation Across Delaware (2023)
- March 2022 – Warm and Dry Conditions Continue Across Delaware (2022)
- March 2021 – Very Warm with Near Normal Precipitation Across Delaware (2021)
Climate Office Partners


