July Temperatures
Preliminary data indicates that the statewide average temperature in July was 81.0o F, which is 4.4o F above the 1981-2010 mean value of 76.6o F (Figure 1). July 2020 was the warmest July since observations began in 1895, and it is the warmest of any month on record since 1895 for Delaware.
July Precipitation
Delaware’s statewide precipitation for July 2020 averaged 6.42 inches, 2.28 inches above the 1981-2010 mean (Figure 2). The July 2020 precipitation amount was the 17th wettest since 1895, placing this month in the wettest one-third of all Julys since the start of observations.
Statewide Spatial Anomalies
Data from the Delaware Environmental Observing System (DEOS) show that temperature departures were above normal throughout the State (Figure 3). Precipitation was likewise above normal at nearly all locations (Figure 4).
National Anomalies
Temperatures were above normal across most of the eastern one-third of the country, while below normal temperatures were found in both the northwest United States and along the Pacific coast (Figure 5). Precipitation varied greatly across the country as is common when convective rainfall dominates during the summer months (Figure 6). The 500 hPa height pattern for July showed a ridge dominating the eastern portion of North America leading to generally warm weather across that region (Figure 7).
-
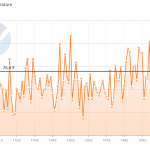
- Figure 1. Delaware statewide mean July temperature (oF) 1895-2020. Black line indicates 1981-2010 normal (NOAA, NCEI, Climate at a Glance: Statewide Time Series).
-
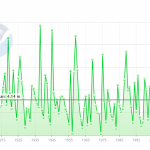
- Figure 2. Delaware statewide July precipitation (inches) 1895-2020. Black line indicates 1981-2010 normal (NOAA, NCEI, Climate at a Glance: Statewide Time Series).
-
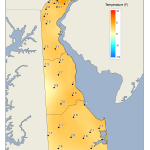
- Figure 3. July 2020 average temperature departures (oF) from the 1981-2010 mean based upon DEOS station data.
-
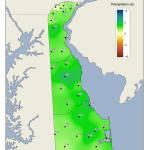
- Figure 4. July 2020 precipitation departures (inches) from the 1981-2010 mean based upon DEOS station data.
-
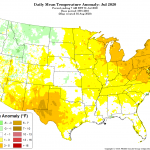
- Figure 5. National daily mean temperature anomalies for July 2020 (from the PRISM Climate Group, OSU).
-
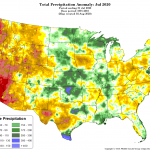
- Figure 6. Total Precipitation Anomaly for July 2020 (from the PRISM Climate Group, OSU).
-
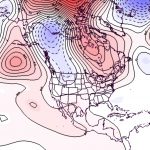
- Figure 7. 500 hPa geopotential height anomalies for July 2020. Negative (blue) anomalies indicate the presence of an anomalous jet stream trough while positive (red) height anomalies indicate the presence of an anomalous jet stream ridge.
Similar Posts
- July 2025 – Very Warm with Above Normal Precipitation Across Delaware (2025)
- July 2024 – Warm with Near Normal Precipitation (2024)
- July 2023 – Warm with Above Normal Precipitation Across Delaware (2023)
- July 2022 – Warm and Dry Conditions Continue Across Delaware (2022)
- July 2021 – Warm and Wet Across Delaware (2021)
Climate Office Partners


