May Temperatures
Preliminary data indicates that the statewide average temperature in May was 64.0° F, which is 1.3° F above the 1981-2010 mean value of 62.7° F (Figure 1). The statewide temperature in May 2021 fell within the top one-third of May observations since 1895.
May Precipitation
Delaware’s statewide precipitation for May 2021 averaged 2.90 inches, 0.96 inches below the 1981-2010 mean (Figure 2). This placed this month’s precipitation total in the middle one-third of all years since 1895.
Statewide Spatial Anomalies
Data from the Delaware Environmental Observing System (DEOS) shows that temperature departures were generally small and varied from station to station across the State (Figure 3). Precipitation was below normal at all stations throughout the State, however, none of the precipitation anomalies were large (Figure 4).
National Anomalies
Temperatures were generally below normal across much of the eastern United States except for New England. Warmer than normal temperatures were found across California and much of the Southwest United States (Figure 5). Precipitation anomalies varied greatly across the country with dry conditions continuing in the Southwest. Portions of the Gulf Coast, from Louisiana to Texas, saw much above normal precipitation (Figure 6). The 500 hPa height pattern for May shows no strong jet stream anomalies across the country (Figure 7), leading to the relatively mild temperature anomalies for the month.
-
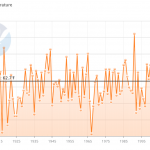
- Figure 1. Delaware statewide mean May temperature (oF) 1895-2021. Black line indicates 1981-2010 normal (NOAA, NCEI, Climate at a Glance: Statewide Time Series).
-
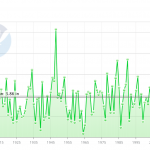
- Figure 2. Delaware statewide May precipitation (inches) 1895-2021. Black line indicates 1981-2010 normal (NOAA, NCEI, Climate at a Glance: Statewide Time Series).
-
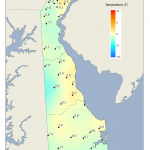
- Figure 3. May 2021 average temperature departures (oF) from the 1981-2010 mean based upon DEOS station data.
-
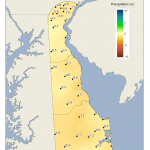
- Figure 4. May 2021 precipitation departures (inches) from the 1981-2010 mean based upon DEOS station data.
-
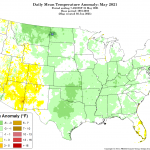
- Figure 5. National daily mean temperature anomalies for May 2021 (from the PRISM Climate Group, OSU).
-
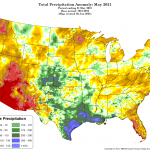
- Figure 6. Total precipitation anomaly for May 2021 (from the PRISM Climate Group, OSU).
-
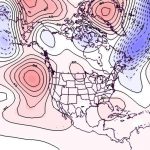
- Figure 7. 500 hPa geopotential height anomalies for May 2021. Negative (blue) anomalies indicate the presence of an anomalous jet stream trough while positive (red) height anomalies indicate the presence of an anomalous jet stream ridge.
Similar Posts
Climate Office Partners


