January Temperatures
Preliminary data indicates that the statewide average temperature in January was 32.2° F, which is 3.0° F below the 1991-2020 mean value of 35.2° F (Figure 1). Although below normal, January’s average temperature was in the middle 33% of all years since observations began in 1895.
January Precipitation
Delaware’s statewide precipitation for January 2022 averaged 4.53 inches, 1.18 inches above the 1991-2020 mean (Figure 2). This placed this month’s precipitation as the 23rd highest January precipitation total since records began in 1895.
Statewide Spatial Anomalies
Data from the Delaware Environmental Observing System (DEOS) show that temperature departures were uniformly below normal across the entire State, with many stations seeing negative temperature anomalies of greater than 3° F (Figure 3). Snowfall events on January 3rd and January 29th left significant snow accumulations, especially across central and southern Delaware, contributing to the higher than normal monthly precipitation.
National Anomalies
Temperatures were below normal across the eastern two-thirds of the United States, with the largest negative temperature anomalies found across the northern tier. The western one-third of the country saw positive anomalies except in portions of the Pacific Northwest (Figure 4). Precipitation anomalies varied greatly across the country (Figure 5), with excessively dry conditions across California, Nevada and much of the Great Plains. Wet conditions were found across the Ohio Valley and the Mid-Atlantic regions. The 500 hPa height pattern for January shows a strong jet stream trough located over eastern North America and a strong jet stream ridge over the western United States contributing to the temperature extremes across those regions (Figure 6).
-
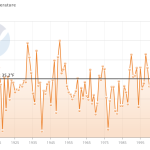
- Figure 1. Delaware statewide mean January temperature (°F) 1895-2022. Black line indicates 1991-2020 normal (NOAA, NCEI, Climate immediately: Statewide Time Series).
-
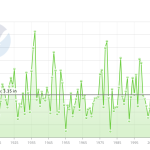
- Figure 2. Delaware statewide January precipitation (inches) 1895-2022. Black line indicates 1991-2020 normal (NOAA, NCEI, Climate at a Glance: Statewide Time Series).
-
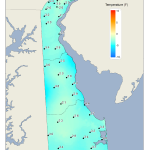
- Figure 3. January 2022 average temperature departures (°F) from the 1991-2020 mean based upon DEOS station data.
-
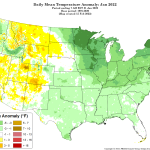
- Figure 4. National daily mean temperature anomalies for January 2022 (from the PRISM Climate Group, OSU).
-
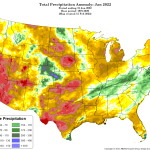
- Figure 5. Total precipitation anomaly for January 2022 (from the PRISM Climate Group, OSU).
-
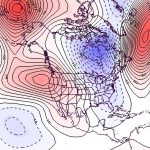
- Figure 6. 500 hPa geopotential height anomalies for January 2022. Negative (blue) anomalies indicate the presence of an anomalous jet stream trough while positive (red) height anomalies indicate the presence of an anomalous jet stream ridge.
Similar Posts
Climate Office Partners


