April Temperatures
Preliminary data indicates that the statewide average temperature in April was 53.8° F, which is 0.6° F below the 1991-2020 mean value of 54.4° F (Figure 1). Even with temperatures cooler than the 1991-2020 mean value, April 2022 still saw temperatures in the top one-third of all years since 1895.
April Precipitation
Delaware’s statewide precipitation for April 2022 averaged 3.98 inches, 0.50 inches above the 1991-2020 mean (Figure 2). This month’s precipitation total was in the top one-third of all years since records began in 1895.
Statewide Spatial Anomalies
Data from the Delaware Environmental Observing System (DEOS) show that temperature departures were below normal across the entire state, with some stations seeing negative temperature anomalies of greater than 2° F (Figure 3). Precipitation was above normal across the northern two thirds of the state, with the largest positive departures found across New Castle County (Figure 4).
National Anomalies
Temperatures were below normal across most of the northern tier of the United States, with some areas seeing negative departures of 7° – 10° F. The southwest portion of the country saw above normal temperatures with some positive departures as much as 5° – 7° F scattered throughout the region (Figure 5). Precipitation anomalies varied greatly across the country (Figure 6), with very dry conditions across the southwestern portion of the nation. Wet conditions were found scattered throughout the country with very high precipitation amounts found across North Dakota and parts of Minnesota. The 500 hPa height pattern for April shows a jet stream trough located over much of northern North America and a jet stream ridge over both the southern Atlantic and Pacific coasts, contributing to the temperature anomalies across those regions (Figure 7).
-
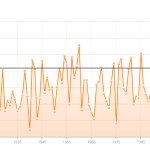
- Figure 1. Delaware statewide mean April temperature (°F) 1895-2022. Black line indicates 1991-2020 normal (NOAA, NCEI, Climate at a Glance: Statewide Time Series).
-
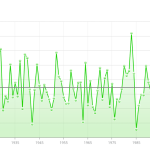
- Figure 2. Delaware statewide April precipitation (inches) 1895-2022. Black line indicates 1991-2020 normal (NOAA, NCEI, Climate at a Glance: Statewide Time Series).
-
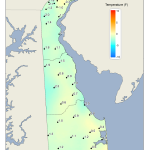
- Figure 3. April 2022 average temperature departures (°F) from the 1991-2020 mean based upon DEOS station data.
-
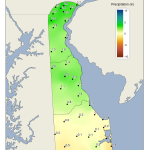
- Figure 4. April 2022 precipitation departures (inches) from the 1991-2020 mean based upon DEOS station data.
-
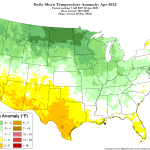
- Figure 5. National daily mean temperature anomalies for April 2022 (from the PRISM Climate Group, OSU).
-
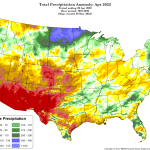
- Figure 6. Total precipitation anomaly for April 2022 (from the PRISM Climate Group, OSU).
-
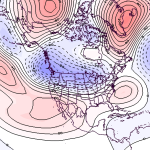
- Figure 7. 500 hPa geopotential height anomalies for April 2022. Negative (blue) anomalies indicate the presence of an anomalous jet stream trough while positive (red) height anomalies indicate the presence of an anomalous jet stream ridge.
Similar Posts
- April 2026 – Very Warm and Dry Across Delaware (2026)
- April 2025 – Warm with Near Normal Precipitation Across Delaware (2025)
- April 2024 – Warm and Dry Across Delaware (2024)
- April 2023 – Very Warm with Above Normal Precipitation Across Delaware (2023)
- April 2021 – Warm with Below Normal Precipitation Across Delaware (2021)
Climate Office Partners


