May Temperatures
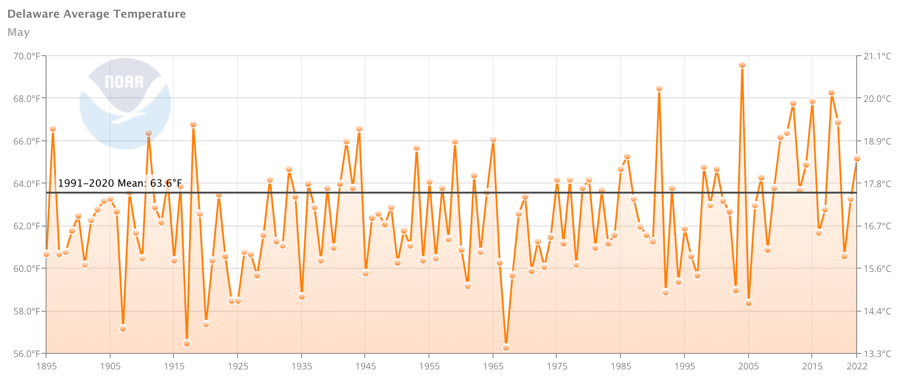
Preliminary data indicates that the statewide average temperature in May was 65.2o F, which is 1.6o F above the 1991-2020 mean value of 63.6o F (Figure 1). This made May of 2022 the 18th warmest since records began in 1895.
May Precipitation
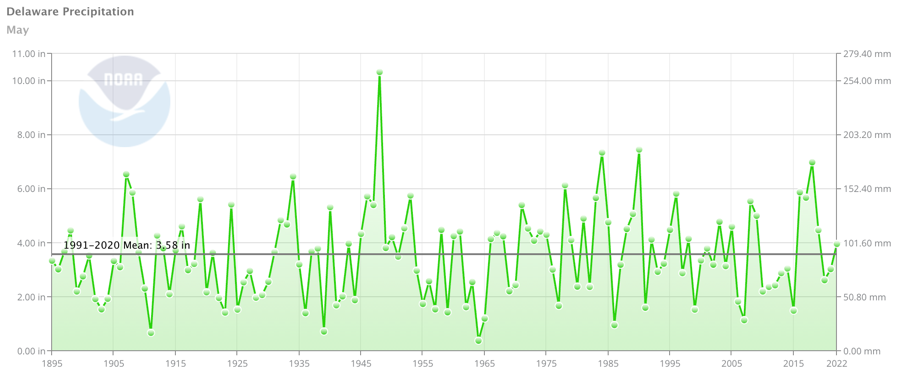
Delaware’s statewide precipitation for May 2022 averaged 3.97 inches, 0.39 inches above the 1991-2020 mean (Figure 2). This month’s precipitation total was in the “normal” category based upon records dating back to 1895.
Statewide Spatial Anomalies
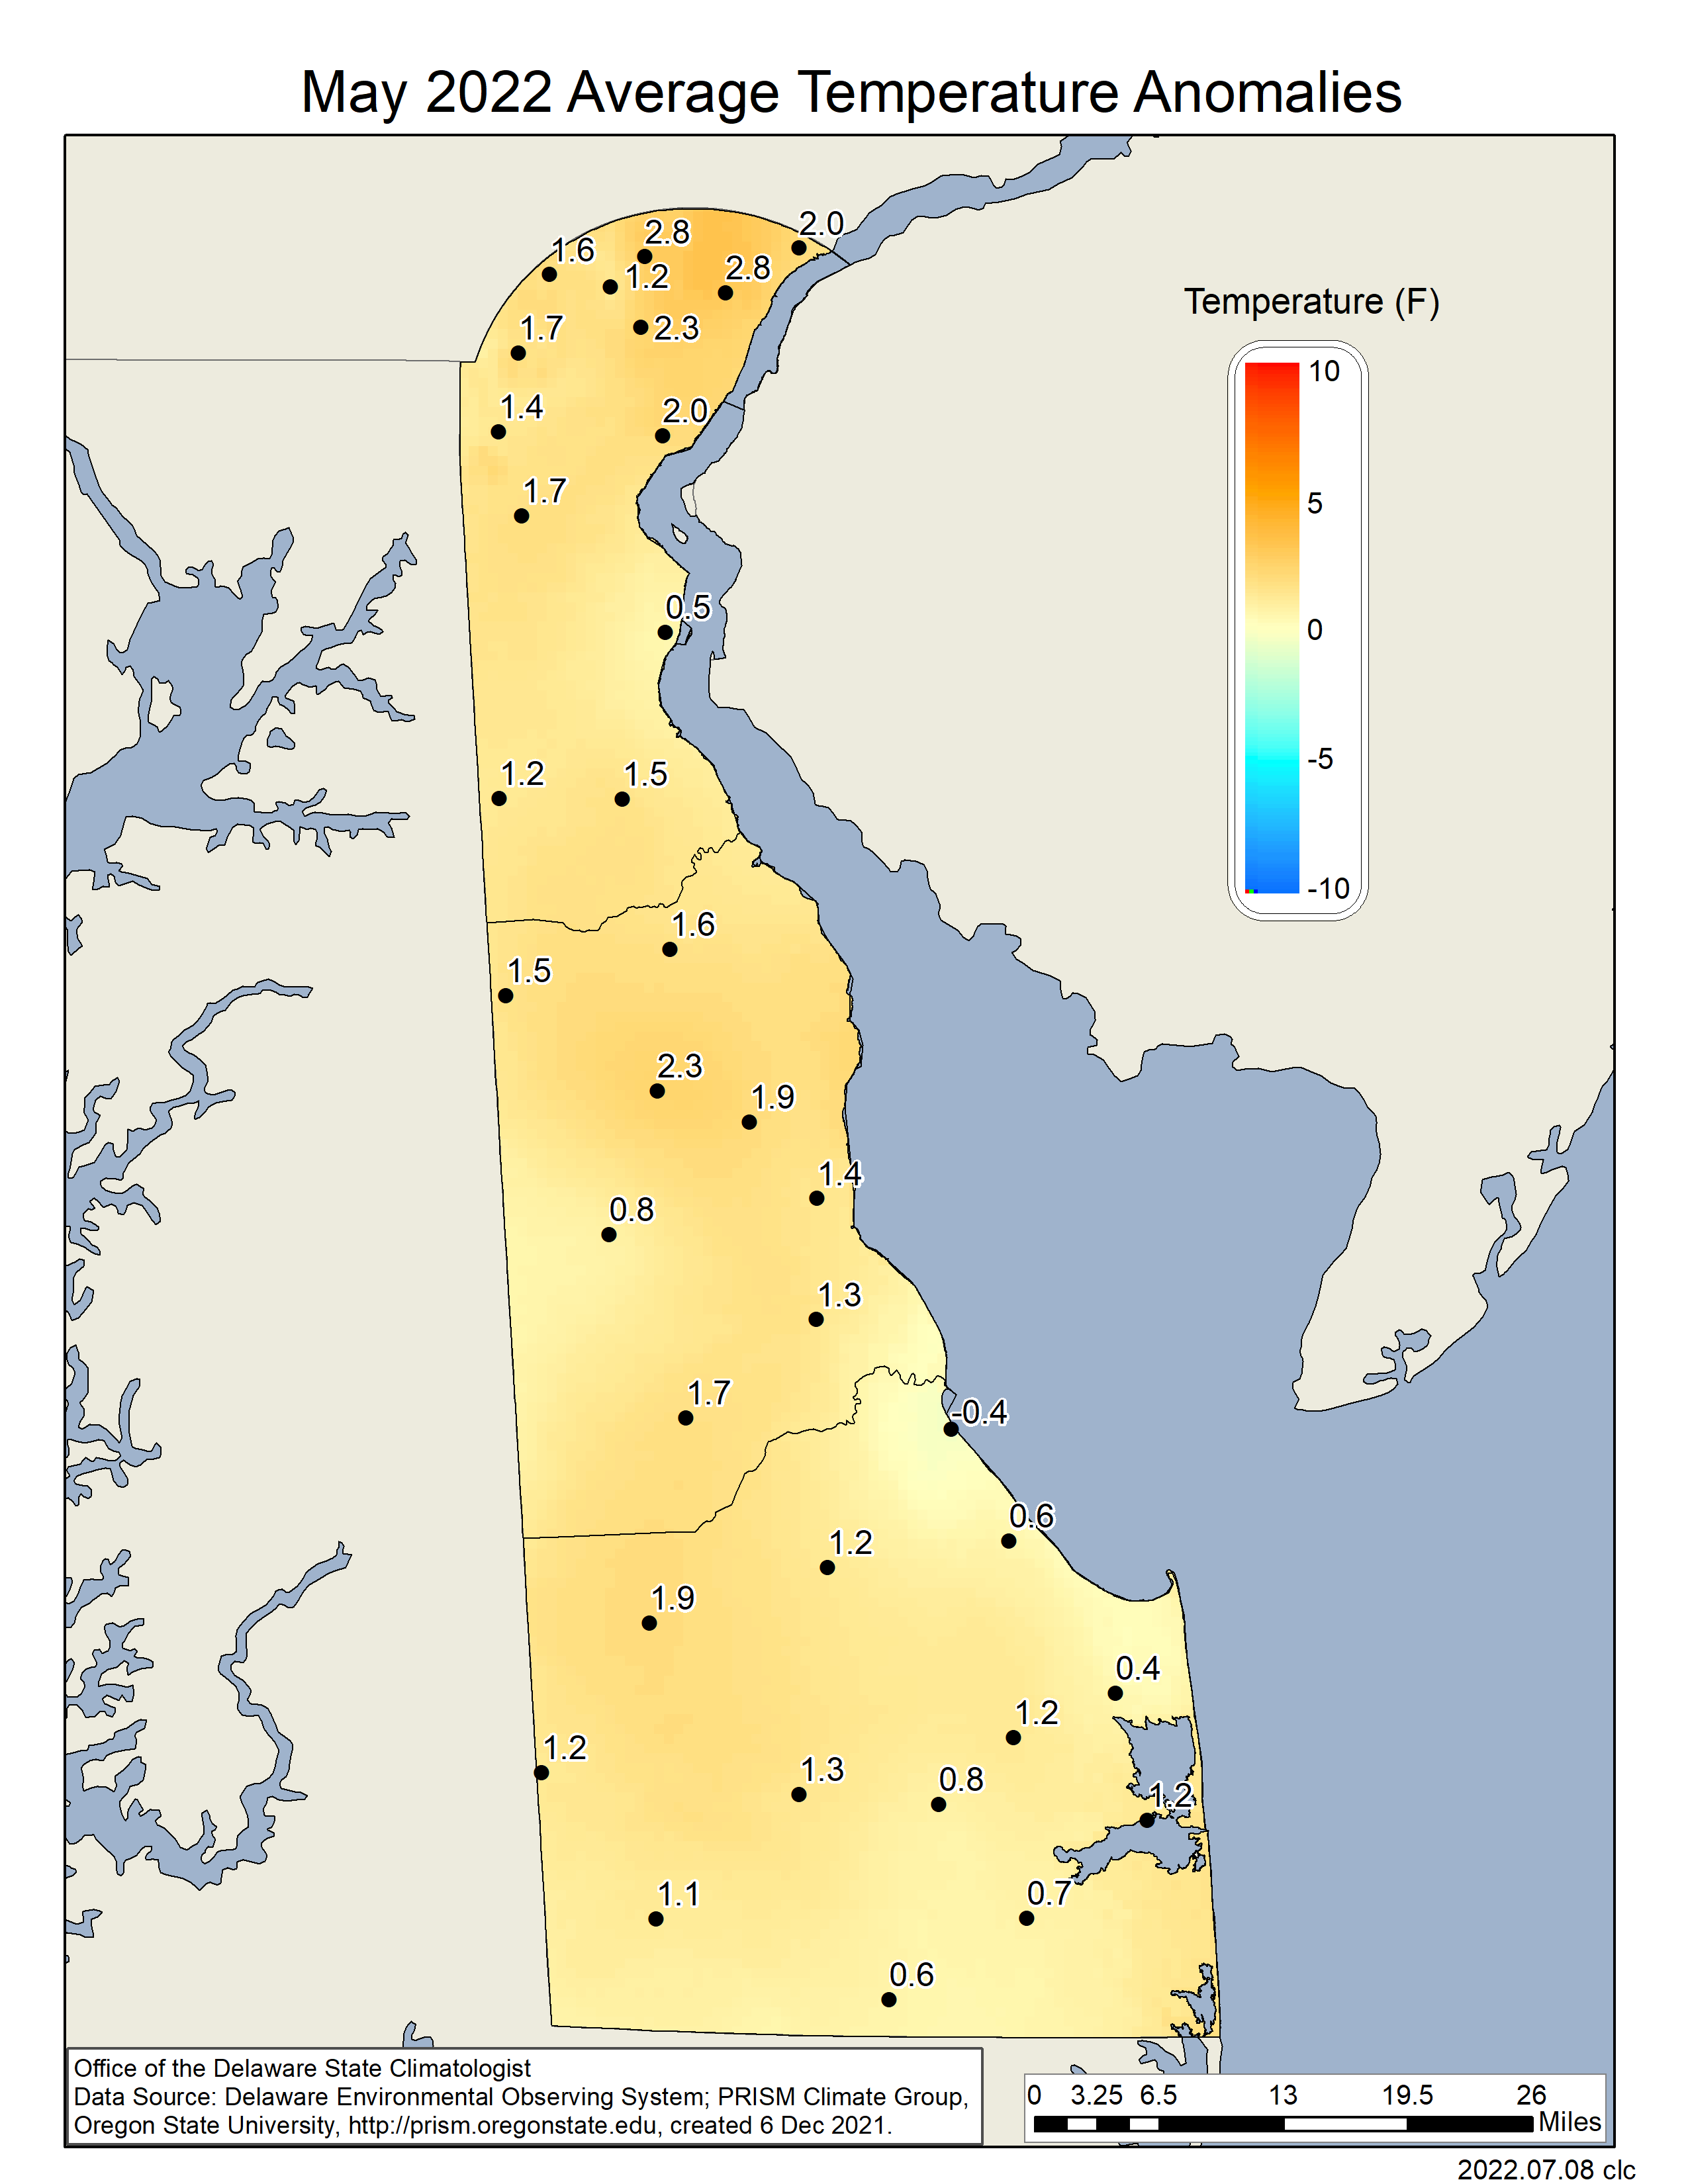
Data from the Delaware Environmental Observing System (DEOS) show that temperature departures were above normal across nearly the entire state, with the most concentrated area of warmth in northern New Castle County (Figure 3). Precipitation varied across Delaware, with most of the northern one-half of the State seeing above normal rainfall and most of the southern one-half of the State seeing slightly below normal precipitation amounts (Figure 4).
National Anomalies
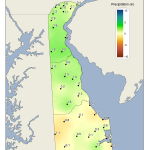
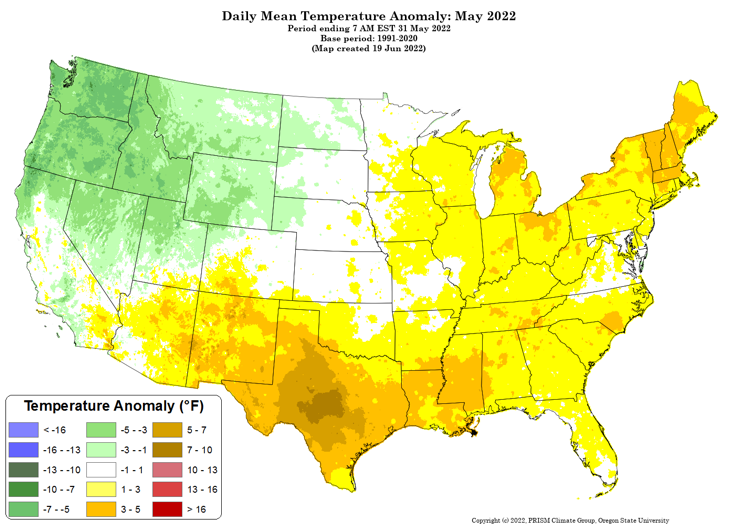
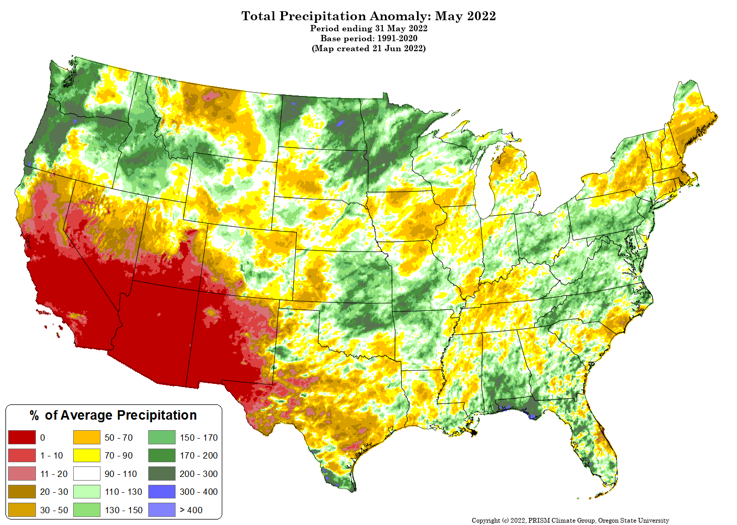
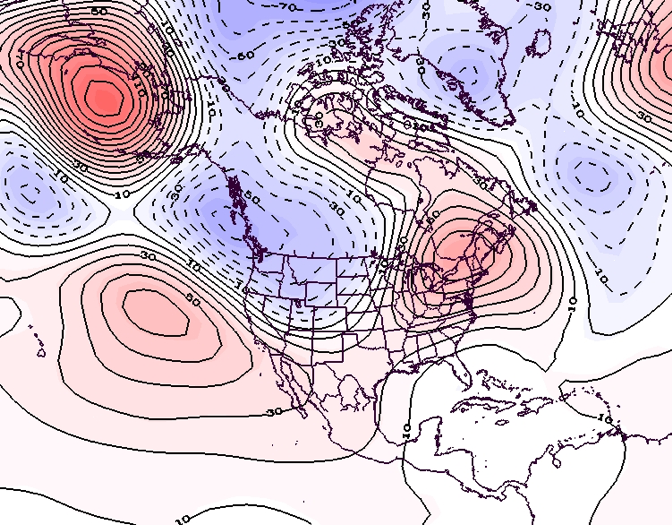
Temperatures were above normal across most of the eastern one-half and southern tier of the United States, with many areas seeing positive departures of 5o – 7o F. The northwest portion of the country saw below normal temperatures with many areas experiencing temperatures 3o – 5o F below average (Figure 5). Precipitation anomalies varied greatly across the country (Figure 6), with extremely dry conditions across the southwestern portion of the nation. The 500 hPa height pattern for May shows a jet stream ridge located over much of eastern North America and a jet stream trough over the northwest United States, contributing to the temperature anomalies across those regions (Figure 7).
-
- Figure 1. Delaware statewide mean May temperature (F) 1895-2022. Black line indicates 1991-2020 normal (NOAA, NCEI, Climate at a Glance: Statewide Time Series).
-
- Figure 2. Delaware statewide May precipitation (inches) 1895-2022. Black line indicates 1991-2020 normal (NOAA, NCEI, Climate at a Glance: Statewide Time Series).
-
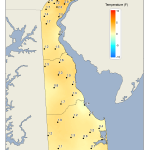
- Figure 3. May 2022 average temperature departures (F) from the 1991-2020 mean based upon DEOS station data.
-
- Figure 4. May 2022 precipitation departures (inches) from the 1991-2020 mean based upon DEOS station data.

-
- Figure 5. National daily mean temperature anomalies for May 2022 (from the PRISM Climate Group, OSU).
-
- Figure 6. Total precipitation anomaly for May 2022 (from the PRISM Climate Group, OSU).
-
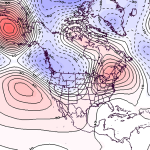
- Figure 7. 500 hPa geopotential height anomalies for May 2022. Negative (blue) anomalies indicate the presence of an anomalous jet stream trough while positive (red) height anomalies indicate the presence of an anomalous jet stream ridge.
Climate Office Partners


