July Temperatures
Preliminary data indicates that the statewide average temperature in July was 79.0o F, which is 1.6o F above the 1991-2020 mean value of 77.4o F (Figure 1). July 2022 was tied with July 1901 and 1999 as the 10th warmest since observations began in 1895.
July Precipitation
Delaware’s statewide precipitation for July 2022 averaged 3.84 inches, 0.58 inches below the 1991-2020 mean (Figure 2). This month’s precipitation ranking was in the “normal” range when compared to Julys since 1895.
Statewide Spatial Anomalies
Data from the Delaware Environmental Observing System (DEOS) show that temperature departures were above normal across the majority of the state (Figure 3). Precipitation observations varied across the state due to the nature of the summer’s convective (thunderstorm) activity, with the largest negative precipitation anomalies occurring in coastal Sussex County (Figure 4).
National Anomalies
Temperatures were above normal across most of the conterminous United States, with portions of Texas seeing positive departures of 5o – 7o F (Figure 5). Precipitation anomalies varied greatly across the country (Figure 6), with very dry conditions across portions of California, Texas and from New Jersey through southern New England. Wet conditions were found mainly across the Ohio River Basin. The 500 hPa height pattern for July shows a weak jet stream ridge covering much of the United States (except the Northeast) contributing to the positive temperature anomalies across the country (Figure 7).
-
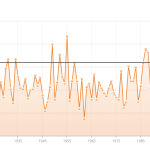
- Figure 1. Delaware statewide mean July temperature (°F) 1895-2022. Black line indicates 1991-2020 normal (NOAA, NCEI, Climate at a Glance: Statewide Time Series).
-
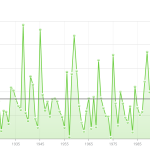
- Figure 2. Delaware statewide July precipitation (inches) 1895-2022. Black line indicates 1991-2020 normal (NOAA, NCEI, Climate at a Glance: Statewide Time Series).
-
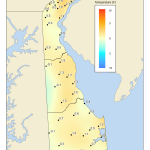
- Figure 3. July 2022 average temperature departures (°F) from the 1991-2020 mean based upon DEOS station data.
-
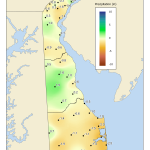
- Figure 4. July 2022 precipitation departures (inches) from the 1991-2020 mean based upon DEOS station data.
-
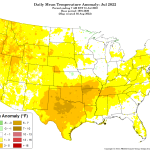
- Figure 5. National daily mean temperature anomalies for July 2022 (from the PRISM Climate Group, OSU).
-
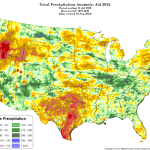
- Figure 6. Total precipitation anomalies for July 2022 (from the PRISM Climate Group, OSU).
-
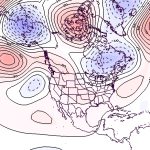
- Figure 7. 500 hPa geopotential height anomalies for July 2022. Negative (blue) anomalies indicate the presence of an anomalous jet stream trough while positive (red) height anomalies indicate the presence of an anomalous jet stream ridge.
Similar Posts
- July 2025 – Very Warm with Above Normal Precipitation Across Delaware (2025)
- July 2024 – Warm with Near Normal Precipitation (2024)
- July 2023 – Warm with Above Normal Precipitation Across Delaware (2023)
- July 2021 – Warm and Wet Across Delaware (2021)
- July 2020 – Record Warmth and Very Wet Across Delaware (2020)
Climate Office Partners


