January Temperatures
Preliminary data indicates that the statewide average temperature in January was 43.1o F, which is 7.9o F above the 1991-2020 mean value of 35.2o F (Figure 1). January 2023 was the third warmest since observations began in 1895.
January Precipitation
Delaware’s statewide precipitation for January 2023 averaged 2.41 inches, 0.94 inches below the 1991-2020 mean (Figure 2). This month’s precipitation was in the bottom one-third of values since observations began in 1895.
Statewide Spatial Anomalies
Data from the Delaware Environmental Observing System (DEOS) show that temperature departures were uniformly positive across the entire state (Figure 3) with some stations seeing positive anomalies of up to 10.0o F. Precipitation anomalies were uniformly negative across the entire state, with the largest negative anomalies found in Sussex County (Figure 4).
National Anomalies
Temperatures were much above normal across the eastern one-half of the United States and below normal across most of the western portion of the country (Figure 5). Precipitation departures were mixed across the country, with the largest positive precipitation anomalies found in California, continuing the relief of drought conditions there (Figure 6).
The 500 hPa height pattern for January shows a jet stream trough over the western United States and a jet stream ridge over the east, contributing to the temperature anomalies across each region (Figure 7).
-
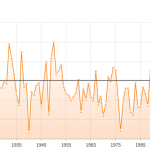
- Figure 1. Delaware statewide mean January temperature (oF) 1895-2023. Black line indicates 1991-2020 normal (NOAA, NCEI, Climate at a Glance: Statewide Time Series).
-
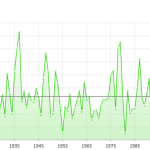
- Figure 2. Delaware statewide January precipitation (inches) 1895-2023. Black line indicates 1991-2020 normal (NOAA, NCEI, Climate at a Glance: Statewide Time Series).
-
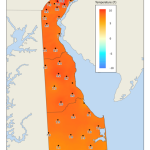
- Figure 3. January 2023 average temperature departures (oF) from the 1991-2020 mean based upon DEOS station data.
-
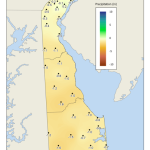
- Figure 4. January 2023 precipitation departures (inches) from the 1991-2020 mean based upon DEOS station data.
-
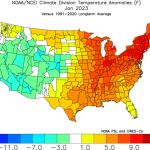
- Figure 5. NOAA/NCEI climate division temperature anomalies (oF) for January 2023 (from NOAA Physical Sciences Laboratory).
-
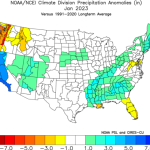
- Figure 6. NOAA/NCEI climate division precipitation anomalies (inches) for January 2023 (from NOAA Physical Sciences Laboratory).
-
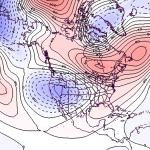
- Figure 7. 500 hPa geopotential height anomalies for January 2023. Negative (blue) anomalies indicate the presence of an anomalous jet stream trough while positive (red) height anomalies indicate the presence of an anomalous jet stream ridge.
Similar Posts
Climate Office Partners


