February Temperatures
Preliminary data indicates that the statewide average temperature in February was 42.9o F, which is 5.8o F above the 1991-2020 mean value of 37.1o F (Figure 1). February 2023 was the third warmest since observations began in 1895.
February Precipitation
Delaware’s statewide precipitation for February 2023 averaged 1.80 inches, 1.11 inches below the 1991-2020 mean (Figure 2). This month’s precipitation was tied with 1913 as the 19th driest since 1895.
Statewide Spatial Anomalies
Data from the Delaware Environmental Observing System (DEOS) show that temperature departures were uniformly positive across the entire state (Figure 3) with some stations seeing positive anomalies of over 7.0o F. Precipitation anomalies were uniformly negative across the entire state, with the largest negative anomalies found in New Castle County (Figure 4).
National Anomalies
Temperatures were much above normal across the eastern one-half of the United States and below normal across most of the western portion of the country (Figure 5). Precipitation departures were mixed across the country, with the largest positive precipitation anomalies found in the western Great Lakes region (Figure 6). Precipitation was below normal over much of the Atlantic and Gulf Coasts and the Pacific Northwest. The 500 hPa height pattern for February shows a jet stream ridge over the eastern United States and a jet stream trough over the west, contributing to the temperature anomalies across each region (Figure 7).
-
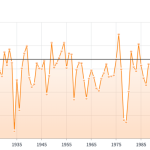
- Figure 1. Delaware statewide mean February temperature (oF) 1895-2023. Black line indicates 1991-2020 normal (NOAA, NCEI, Climate at a Glance: Statewide Time Series).
-
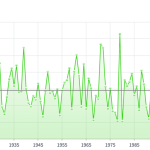
- Figure 2. Delaware statewide February precipitation (inches) 1895-2023. Black line indicates 1991-2020 normal (NOAA, NCEI, Climate at a Glance: Statewide Time Series).
-
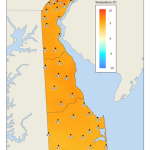
- Figure 3. February 2023 average temperature departures (oF) from the 1991-2020 mean based upon DEOS station data.
-
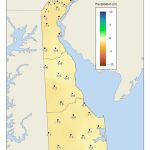
- Figure 4. February 2023 precipitation departures (inches) from the 1991-2020 mean based upon DEOS station data.
-
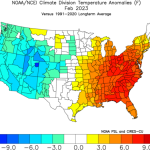
- Figure 5. NOAA/NCEI climate division temperature anomalies (oF) for February 2023 (from NOAA Physical Sciences Laboratory).
-
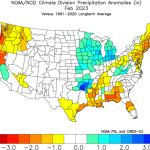
- Figure 6. NOAA/NCEI climate division precipitation anomalies (inches) for February 2023 (from NOAA Physical Sciences Laboratory).
-
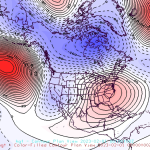
- Figure 7. 500 hPa geopotential height anomalies for February 2023. Negative (blue) anomalies indicate the presence of an anomalous jet stream trough while positive (red) height anomalies indicate the presence of an anomalous jet stream ridge.
Similar Posts
- February 2026 – Cold with Near Normal Precipitation Across Delaware (2026)
- February 2025 – Cool with Near Normal Precipitation Across Delaware (2025)
- Winter 2023-2024 – Very Warm and Very Wet Across Delaware (2024)
- February 2024 – Warm and Dry Across Delaware (2024)
- February 2022 – Warm and Dry Conditions Return to Delaware (2022)
Climate Office Partners


