May Temperatures
Preliminary data indicates that the statewide average temperature in May was 62.1oF, which is 1.5oF below the 1991-2020 mean value of 63.6oF (Figure 1). May 2023 temperature was in the “normal” range of observations since 1895.
May Precipitation
Delaware’s statewide precipitation for May 2023 averaged 2.22 inches, 1.36 inches below the 1991-2020 mean of 3.58 inches (Figure 2). This month’s precipitation was in the bottom one-third of all observations since 1895.
Statewide Spatial Anomalies
Data from the Delaware Environmental Observing System (DEOS) show that temperature departures were uniformly negative across the entire state (Figure 3) with many locations seeing negative anomalies of more than 3oF. Precipitation anomalies were negative across the majority of the state, with many stations in New Castle County recording negative departures of more than three inches (Figure 4).
National Anomalies
Temperatures were generally above normal across the northwestern United States (Figure 5), while most of the eastern one-third of the country saw below normal temperatures (Figure 5). Precipitation departures were negative across most of the eastern United States (Figure 6), while the High Plains and Florida saw positive precipitation departures. The 500 hPa height pattern for May shows a jet stream ridge covering most of the western two-thirds of North America, while much of the eastern one-third of the United States was covered by a jet stream trough, contributing to the temperature anomalies found across these regions (Figure 7).
-
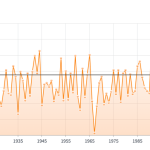
- Figure 1. Delaware statewide mean May temperature (oF) 1895-2023. Black line indicates 1991-2020 normal (NOAA, NCEI, Climate at a Glance: Statewide Time Series).
-
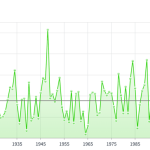
- Figure 2. Delaware statewide May precipitation (inches) 1895-2023. Black line indicates 1991-2020 normal (NOAA, NCEI, Climate at a Glance: Statewide Time Series).
-

- Figure 3. May 2023 average temperature departures (oF) from the 1991-2020 mean based upon DEOS station data.
-
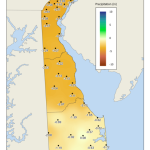
- Figure 4. May 2023 precipitation departures (inches) from the 1991-2020 mean based upon DEOS station data.
-

- Figure 5. NOAA/NCEI climate division temperature anomalies (oF) for May 2023 (from NOAA Physical Sciences Laboratory).
-
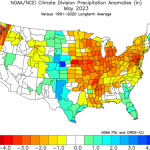
- Figure 6. NOAA/NCEI climate division precipitation anomalies (inches) for May 2023 (from NOAA Physical Sciences Laboratory).
-
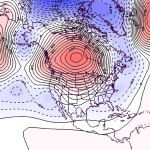
- Figure 7. 500 hPa geopotential height anomalies for May 2023. Negative (blue) anomalies indicate the presence of an anomalous jet stream trough while positive (red) height anomalies indicate the presence of an anomalous jet stream ridge.
Similar Posts
Climate Office Partners


