October Temperatures
Preliminary data indicates that the statewide average temperature in October was 60.4°F, which was 2.4°F above the 1991-2020 mean value of 58.0°F (Figure 1). This October’s temperature was the 13th warmest since observations began in 1895.
October Precipitation
Delaware’s statewide precipitation for October 2023 averaged 1.40 inches, 2.54 inches below the 1991-2020 mean of 3.94 inches (Figure 2). This month’s statewide precipitation total was the 15th driest October total since observations began in 1895.
Statewide Spatial Anomalies
Data from the Delaware Environmental Observing System (DEOS) show that temperature departures were primarily positive across the state, with the highest positive departures found across the Wilmington metropolitan area (Figure 3). Precipitation was below normal at every station, with some locations seeing negative anomalies of greater than three inches (Figure 4).
National Anomalies
Temperatures were generally above or near normal across the entire country, with the largest positive anomalies of 5° to 7°F found across New England (Figure 5). Negative precipitation departures dominated the eastern and western United States, while the central portion of the country saw generally above normal precipitation (Figure 6). The 500 hPa height pattern for October shows a weak jet stream trough covering the Atlantic Coast of the U.S. (Figure 7).
-
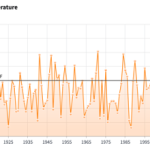
- Figure 1. Delaware statewide mean October temperature (degrees F) 1895-2023. Black line indicates 1991-2020 normal (NOAA, NCEI, Climate at a Glance: Statewide Time Series).
-
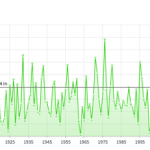
- Figure 2. Delaware statewide October precipitation (inches) 1895-2023. Black line indicates 1991-2020 normal (NOAA, NCEI, Climate at a Glance: Statewide Time Series).
-
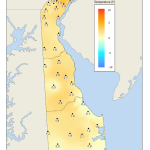
- Figure 3. October 2023 average temperature departures (degrees F) from the 1991-2020 mean based upon DEOS station data.
-
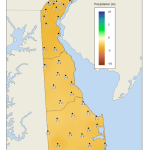
- Figure 4. October 2023 precipitation departures (inches) from the 1991-2020 mean based upon DEOS station data.
-
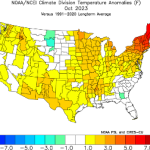
- Figure 5. NOAA/NCEI climate division temperature anomalies (degrees F) for October 2023 (from NOAA Physical Sciences Laboratory).
-
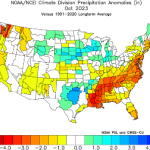
- Figure 6. NOAA/NCEI climate division precipitation anomalies (inches) for October 2023 (from NOAA Physical Sciences Laboratory).
-
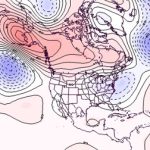
- Figure 7. 500 hPa geopotential height anomalies for October 2023. Negative (blue) anomalies indicate the presence of an anomalous jet stream trough while positive (red) height anomalies indicate the presence of an anomalous jet stream ridge.
Similar Posts
- October 2025 – Near Normal Temperatures with Below Normal Precipitation Across Delaware (2025)
- October 2024 – Record Dry Conditions with Near Normal Temperatures (2024)
- October 2022 – Below Normal Temperatures and Near Normal Precipitation Across Delaware (2022)
- October 2021 – Very Warm with Near Normal Precipitation Across Delaware (2021)
- October 2020 – Warm and Wet Across Delaware (2020)
Climate Office Partners


