March Temperatures
Preliminary data indicates that the statewide average temperature in March was 48.5 °F, which is 4.3°F above the 1991-2020 mean value of 44.2°F (Figure 1). March’s temperature was tied with March 1977 as the 8th warmest since records began in 1895.
March Precipitation
Delaware’s statewide precipitation for March 2024 averaged 7.49 inches, 3.37 inches above the 1991-2020 mean of 4.12 inches (Figure 2). March’s precipitation was the 3rd highest in the last 130 years.
Statewide Spatial Anomalies
Data from the Delaware Environmental Observing System (DEOS) show that temperature departures were positive across the entire state (Figure 3) with some locations seeing positive anomalies of more than 6° F in northern New Castle County. Precipitation anomalies were uniformly positive across the entire state, with the largest departures found in southern Sussex County (Figure 4).
National Anomalies
Temperatures were above normal across nearly the entire country with positive anomalies of 7° to 9°F found across areas surrounding the Great Lakes (Figure 5). Only the Southwest and extreme north-central portions of the country saw near or just below normal temperatures. Precipitation departures were positive along the Atlantic Coast, parts of the Southeast, and portions of the western U.S. (Figure 6), while the Ohio Valley Region saw significantly below-normal precipitation. The 500 hPa height pattern for March shows an anomalous jet stream trough located over the western U.S., while ridging was found over the northeastern U.S. and southeast Canada (Figure 7). These jet stream anomalies were associated with the temperature anomalies found across the country.
-
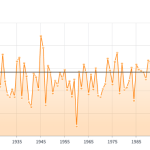
- Figure 1. Delaware statewide mean March temperature (degrees F) 1895-2024. Black line indicates 1991-2020 normal (NOAA, NCEI, Climate at a Glance: Statewide Time Series).
-
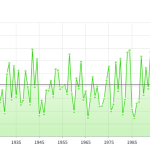
- Figure 2. Delaware statewide March precipitation (inches) 1895-2024. Black line indicates 1991-2020 normal (NOAA, NCEI, Climate at a Glance: Statewide Time Series).
-
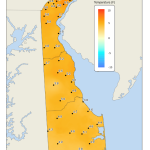
- Figure 3. March 2024 average temperature departures (degrees F) from the 1991-2020 mean based upon DEOS station data.
-
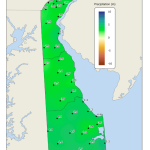
- Figure 4. March 2024 precipitation departures (inches) from the 1991-2020 mean based upon DEOS station data.
-
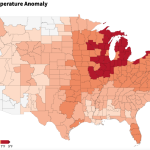
- Figure 5. United States climate division temperature anomalies (degrees F) for March 2024 (NOAA, NCEI, Climate at a Glance: Divisional Mapping).
-
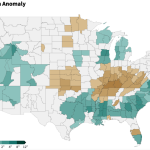
- Figure 6. United States climate division precipitation anomalies (inches) for March 2024 (NOAA, NCEI, Climate at a Glance: Divisional Mapping).
-
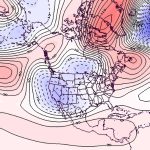
- Figure 7. 500 hPa geopotential height anomalies for March 2024. Negative (blue) anomalies indicate the presence of an anomalous jet stream trough while positive (red) height anomalies indicate the presence of an anomalous jet stream ridge.
Similar Posts
- March 2026 – Very Warm with Below Normal Precipitation Across Delaware (2026)
- March 2025 – Very Warm with Above Normal Precipitation Across Delaware (2025)
- March 2023 – Warm with Much Below Normal Precipitation Across Delaware (2023)
- March 2022 – Warm and Dry Conditions Continue Across Delaware (2022)
- March 2021 – Very Warm with Near Normal Precipitation Across Delaware (2021)
Climate Office Partners


