December Temperatures
Preliminary data indicates that the statewide average temperature in December was 35.0o F, which is 4.5o F below the 1991-2020 mean value of 39.5o F (Figure 1). December 2025 was tied with 1934 and 1983 as the 39th coldest December since 1895.
December Precipitation
Delaware’s statewide precipitation for December 2025 averaged 2.47 inches, 1.38 inches below the 1991-2020 mean of 3.85 inches (Figure 2). December 2025 was the 37th driest December since 1895.
Statewide Spatial Anomalies
Data from the Delaware Environmental Observing System (DEOS) show that temperature departures were uniformly negative across the State (Figure 3), with the largest negative temperature anomalies found across Kent and New Castle Counties. Precipitation was below normal throughout the state despite a statewide snowfall event on December 14th that resulted in between 4 inches and 6 inches of snow across New Castle County (Figure 4).
National Anomalies
Temperatures were above normal in the western portion of the United States with some positive anomalies reaching over 8o F in the Rocky Mountains (Figure 5). Much of the Northeast and Great Lakes experienced below normal temperatures during the month. Precipitation varied across the country (Figure 6) with much of the southeastern portions of the United States seeing negative precipitation anomalies, while much of the Pacific Coast, the Pacific Northwest, and portions of the Great Lakes saw above normal precipitation. The 500 hPa height pattern for December showed a strong anomalous jet stream ridge across the western portions of the country, and a strong jet stream trough across the Northeast, contributing to the temperature anomalies in each region (Figure 7).
Global Anomalies
December 2025 ranked as the fifth warmest December on record for the globe since 1850. Global temperatures were 1.89o F (1.05o C) above the 1901-2000 mean. Particular warmth was found across the western United States and the Arctic, while Alaska, Canada, and much of northern Asia saw colder than normal conditions (Figure 8).
-
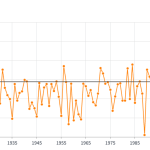
- Figure 1. Delaware statewide mean December temperature (degrees F) 1895-2025. The black line indicates the 1991-2020 normal (NOAA, NCEI, Climate at a Glance: Statewide Time Series).
-
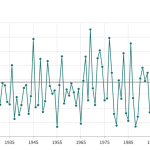
- Figure 2. Delaware statewide December precipitation (inches) 1895-2025. The Black line indicates the 1991-2020 normal (NOAA, NCEI, Climate at a Glance: Statewide Time Series).
-
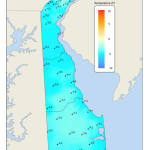
- Figure 3. December 2025 average temperature departures (degrees F) from the 1991-2020 mean based upon DEOS station data.
-
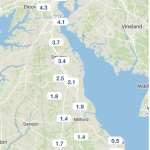
- Figure 4. December 14th, 2025 snowfall totals (inches) based upon DEOS station data.
-
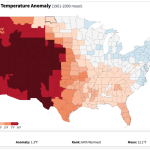
- Figure 5. United States climate division temperature anomalies (degrees F) for December 2025 (NOAA, NCEI, Climate at a Glance: Divisional Mapping).
-
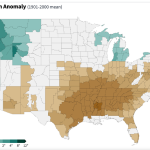
- Figure 6. United States climate division precipitation anomalies (inches) for December 2025 (NOAA, NCEI, Climate at a Glance: Divisional Mapping).
-
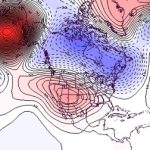
- Figure 7. 500 hPa geopotential height anomalies for December 2025. Negative (blue) anomalies indicate the presence of an anomalous jet stream trough while positive (red) height anomalies indicate the presence of an anomalous jet stream ridge.
-
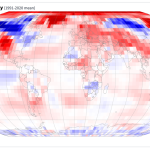
- Figure 8. Global temperature anomalies (degrees C) for December 2025 (NOAA, NCEI, Climate at a Glance: Global Mapping).
Similar Posts
- December 2024 – Cool and Dry Across Delaware (2025)
- Winter 2023-2024 – Very Warm and Very Wet Across Delaware (2024)
- December 2023 – Very Warm with Record Precipitation (2024)
- December 2022 – Cool with Above Normal Precipitation Across Delaware (2023)
- December 2021 – Near Record Warmth and Extremely Dry Conditions Across Delaware (2022)
Climate Office Partners


