February Temperatures
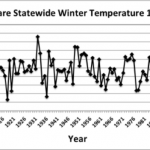
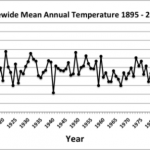
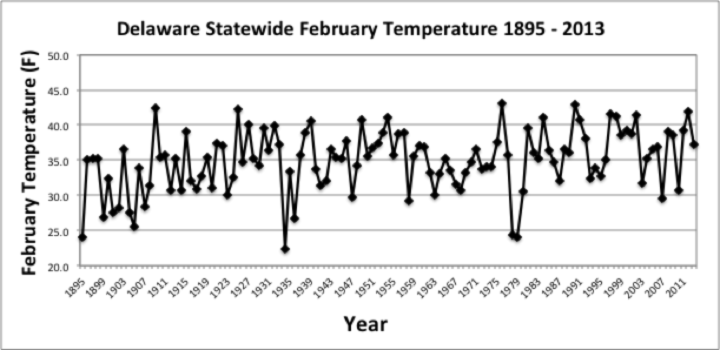
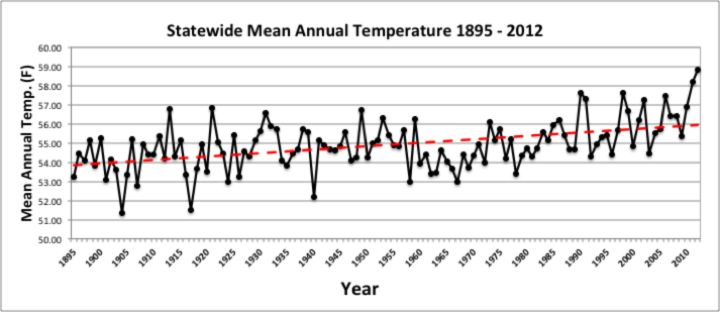
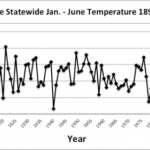
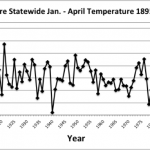
Statewide average temperature in February was 34.5°F according to preliminary data from the National Climatic Data Center (NCDC). This was 2.0°F below the 1981-2010 normal of 36.5°F (Figure 1). Although below normal for the most recent 30-year period, February 2014 was only the 54th coldest since records began in 1895.
February Precipitation
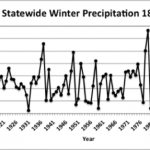
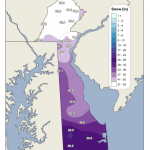
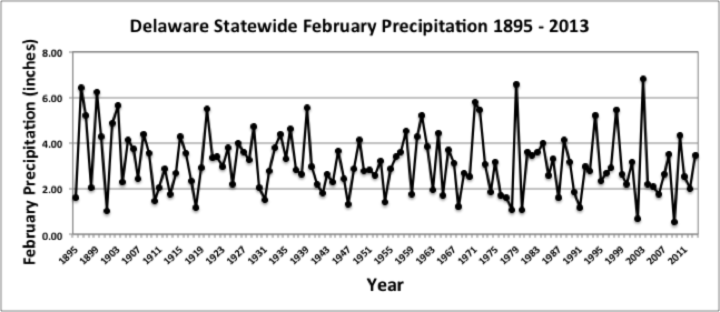
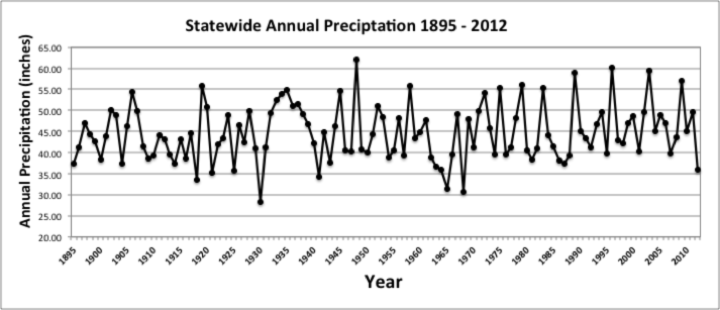
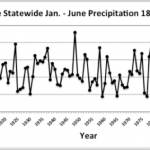
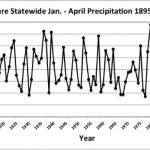
Statewide precipitation in February averaged 4.23 inches, 1.32 inches above the 1981-2010 mean of 2.91 inches (Figure 2). Many areas of the state saw substantial snowfall during the month with portions of northern Delaware and Chester County, PA receiving between 15 and 30 inches (Figure 3).
Statewide Spatial Averages
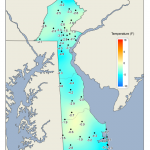
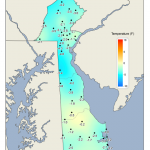
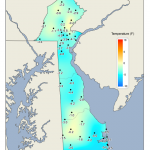
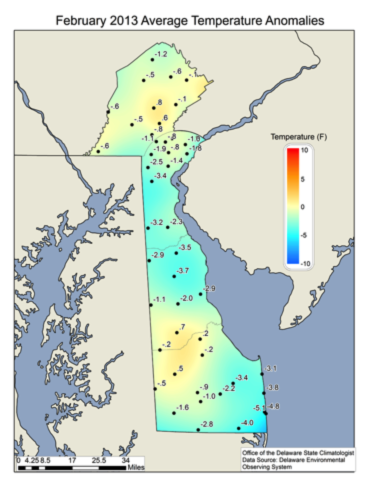
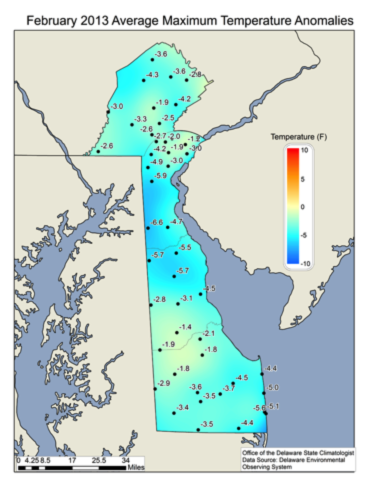
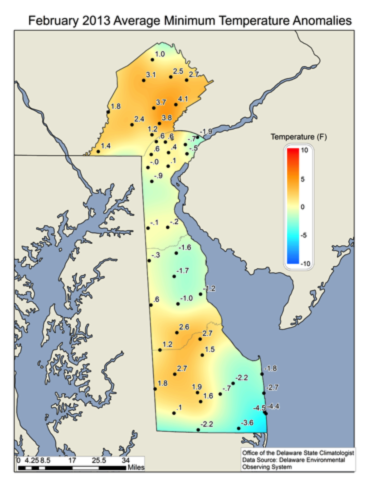
Mean monthly temperatures were well below normal across the entire state and at all DEOS stations (deos.udel.edu) in February, with the largest negative temperature anomalies found across northern Kent and New Castle Counties (Figure 4).
-
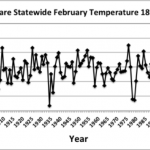
- Figure 1. Delaware statewide mean February temperature (°F) 1895-2014.
-
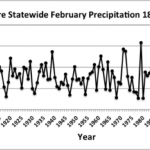
- Figure 2. Delaware statewide mean February precipitation (inches) 1895-2014.
-
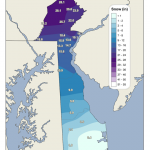
- Figure 3. February 2014 snowfall totals based upon DEOS station data.
-

- Figure 4. February 2014 average temperature departures from the 1981-2010 mean based upon DEOS station data.