
Beach in Summer

Delaware’s Summer 2013 Update

Above normal temperatures and heavy rainfall characterized Delaware’s Climate during summer 2013.
de_statewideSummerTemp-1895-2013_0.png

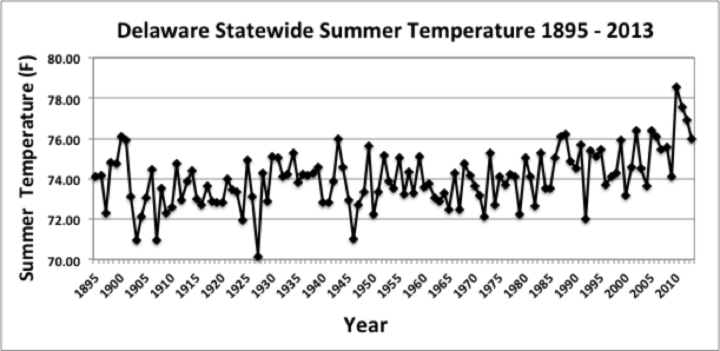
Figure 1. Delaware statewide mean Summer temperature (°F) 1895-2013.
de_statewideSummerPrecip-1895-2013_0.png

Figure 2. Delaware statewide Summer precipitation (inches) 1895-2013.

Summer Temperatures

Preliminary data indicates that Delaware had its 4th summer in a row with above normal temperatures. The Statewide mean summer temperature of 76.0 °F was 1.1 °F above the 1981-2010 normal of 74.9°F. This summer’s warmer than normal conditions placed it as the 11th warmest summer since records began in 1895 (Figure 1).

Summer Precipitation

Warm temperatures were accompanied by extremely wet conditions across the state during the summer season. The statewide mean precipitation of 21.41” was 8.96” above the 1981-2010 normal of 12.45”, and was the wettest summer since 21.8” of rain fell during the summer of 1989 (Figure 2), and the 5th wettest summer since records began in 1895.

Statewide Spatial Averages

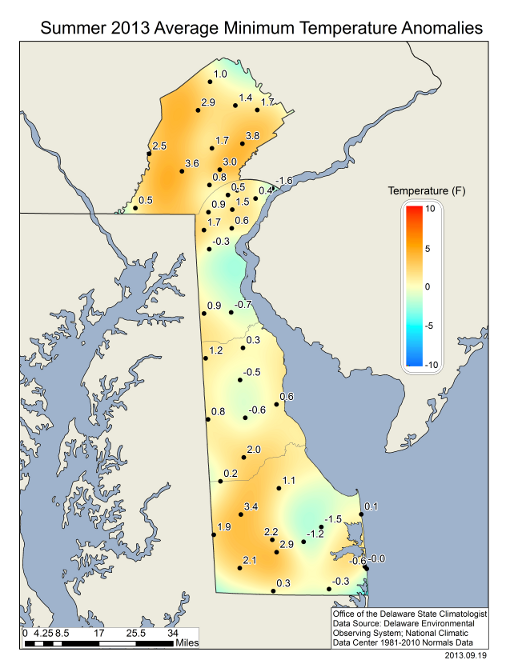
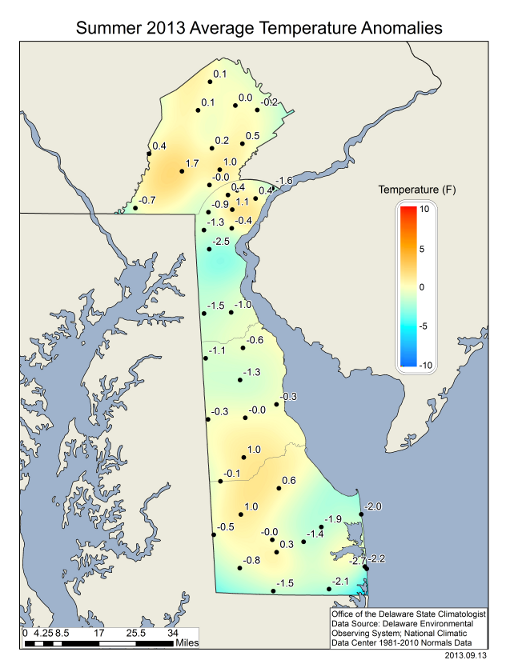
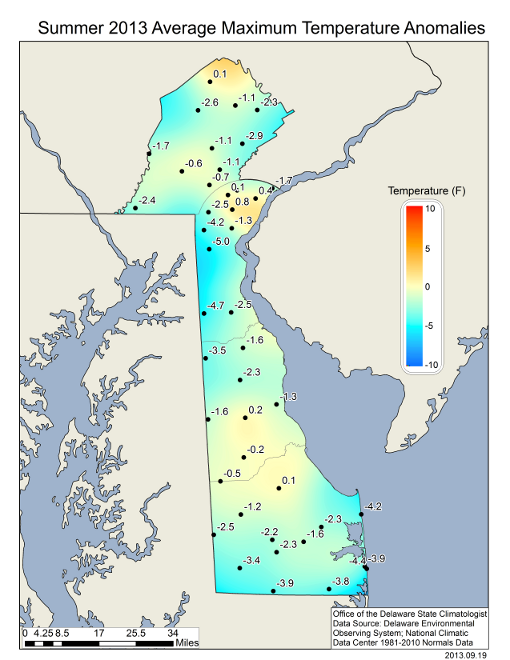
Data from the Delaware Environmental Observing System (DEOS) show that mean summer temperatures across the state varied from generally warmer than normal conditions in northern New Castle, southern Kent and northern Sussex counties to below normal, especially along coastal regions (Figure 3). Mean summer maximum temperatures were generally below normal across the entire state (Figure 4), while mean summer minimum temperatures were above normal in most locations (Figure 5). The lower maximum temperatures and higher minimum temperatures are consistent with the heavy rainfall the state saw during the summer.

All stations in the DEOS network recorded above normal precipitation values during summer 2013. Precipitation anomalies reached greater than ten inches in portions of northern New Castle County and in eastern Sussex County. The driest areas of the state were found in southwestern Kent and northwestern Sussex Counties (Figure 6). Even in these locations, precipitation was above normal for the summer season.
Summer 2013 average temperature departures from the 1981-2010 mean based upon DEOS station data

Figure 3. Summer 2013 average temperature departures from the 1981-2010 mean based upon DEOS station data.
Delaware Summer 2013 maximum temperature departures from the 1981-2010 mean based upon DEOS station data

Figure 4. Summer 2013 maximum temperature departures from the 1981-2010 mean based upon DEOS station data
Delaware Summer 2013 minimum temperature departures from the 1981-2010 mean based upon DEOS station data

Figure 5. Summer 2013 minimum temperature departures from the 1981-2010 mean based upon DEOS station data
Delaware Summer 2013 precipitation departures from the 1981-2010 mean based upon DEOS station data

Figure 6. Summer 2013 precipitation departures from the 1981-2010 mean based upon DEOS station data
 
Syndicate content
Sunrise in Delaware

2012 is Warmest Year on Record for Delaware Since 1895

Statewide Mean Annual Temperature 1895-2012

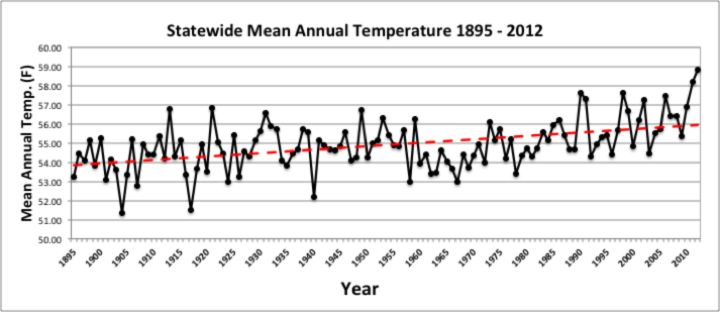
Figure 1. Delaware statewide mean annual temperature (°F) 1895-2012.

Preliminary data indicates that Delaware saw its warmest year on record during 2012.

The mean annual temperature of 58.8 ° F was 3.9 ° F above the 1895 – 2012 mean temperature, making it the warmest year since records began in 1895.

This year broke the previous record of 58.1 ° F set in 2011.

The six warmest years on record have all occurred since 1990 (Figure 1).

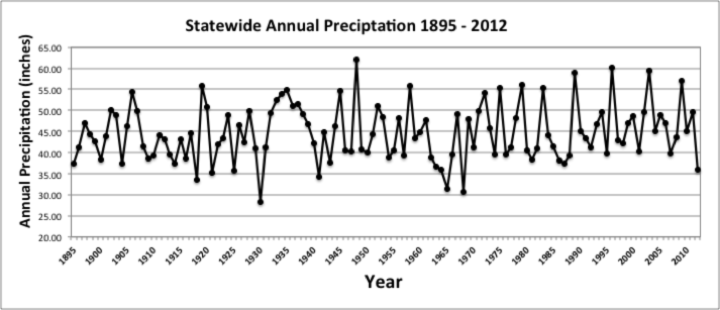
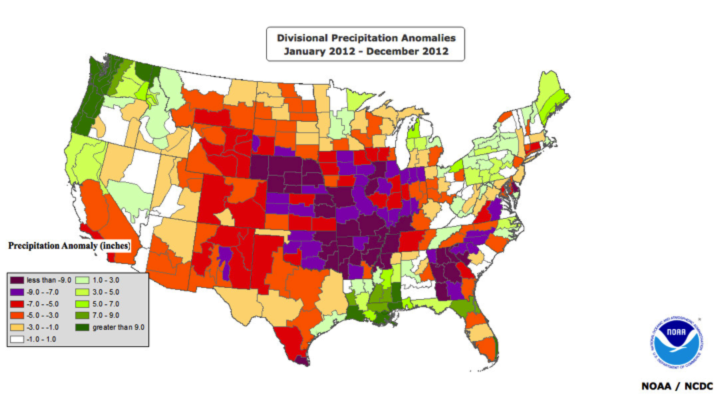
The warm temperatures were accompanied by very dry conditions across the state during the year. The statewide mean precipitation of 34.53” was 10.05” below the 1895-2012 statewide mean, making 2012 the 6th driest year since records began in 1895 (Figure 2).

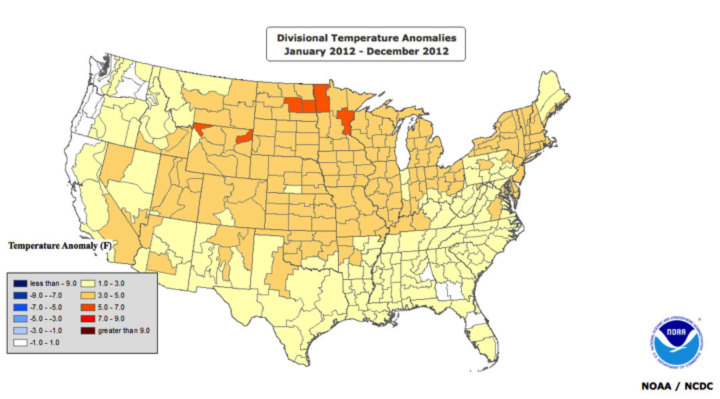
Conditions in Delaware mirrored those across much of the United States.

The contiguous 48 states had their highest temperature and 15th driest year since 1895 (Figures 3 and 4).

 
Statewide Annual Precipitation 1895-2012

Figure 2. Delaware statewide mean precipitation (inches) 1895-2012.
US temperature anomalies for 2012

Figure 3. Temperature anomalies (°F) across the contiguous United States. Map provided by the National Climatic Data Center.
US temperature anomalies for 2012

Figure 4. Precipitation anomalies (inches) across the contiguous United States. Map provided by the National Climatic Data Center.
 
Syndicate content