Highlights:
- January precipitation was 2.03 inches below normal for Delaware. This is the sixth consecutive month of below normal precipitation.
- Streamflows continued to remain on the low end of where they usually are this time of year, with many at below the 10th percentile for the beginning of February.
- Groundwater levels have begun to flatten out, but remain below normal and are currently on par with groundwater levels during our last major, statewide drought from 2001-2002.
- Precipitation chances are quite good over the next 7-10 days, as several weather systems could combine to bring around 2 inches of much needed precipitation to Delaware
New Castle County Drought Indicators:
The flows on the White Clay, Red Clay, and Brandywine are all dropping; however, they remain above drought watch. The chlorides in the Christina River near Newport continued to increase – either due to the continued application of road salt or due to the lack of precipitation. The chlorides in the Delaware River increased slightly and the salt front is currently at river mile 75.5 near Claymont, Delaware. Per the DRBC, the monthly median for the salt front is near river mile 71. The water level in well Db24-18 dropped a bit and is now at 15.5 ft below land surface. The water level in this well typically ranges between 10.0 to 14.2 ft below land surface during the month of February.
Climate Summary:
January was certainly cold AND dry. Here’s a precipitation departures map for our region from basically the month of January:
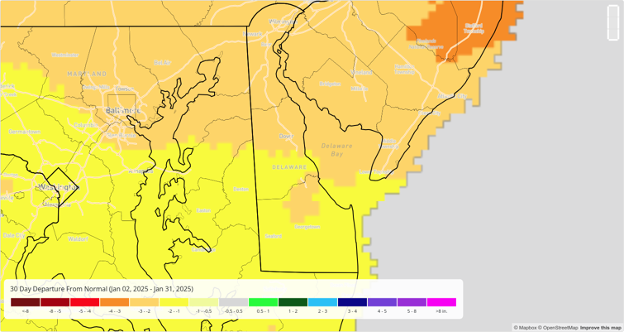
30-day precipitation departures were 2-3 inches (mostly 2 to 2.5 inches) below normal from Dover north, while southern Delaware fared a smidge better (more in the 1.5 to 2.0 inch below normal range). This marks two consecutive below normal months so far this winter when we could have used some above normal precipitation. It also marks the sixth straight month of below normal precipitation statewide. The last above normal month was July 2024. Here are accumulated precipitation graphs for Wilmington and Georgetown from August 1, 2024 to January 31, 2025 (i.e., the last 6 months full months):
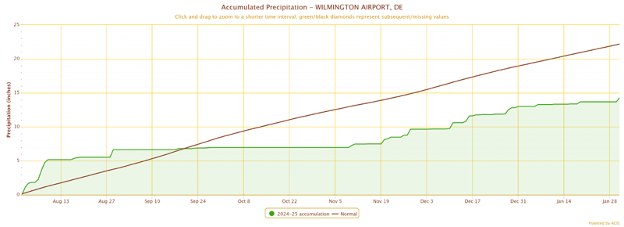
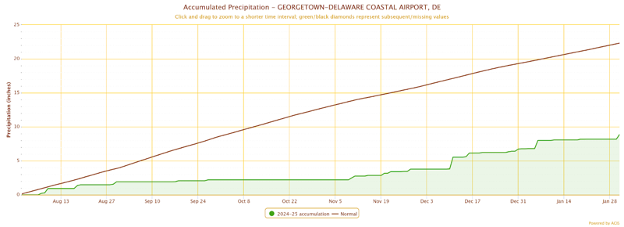
For Wilmington, the last 6 months have been the 5th driest Aug-Jan on record (7.89″ below normal). For Georgetown, it’s much worse. The last 6 months are the driest Aug-Jan on record, with a deficit of 13.44″.
Weather and Climate Outlook:
Thankfully, there is some hope in the upcoming weather pattern. The models are showing three significant weather systems moving through our region between now and the middle of next week. The models are generally pointing to 1.5-2.00 inches of precipitation for most of the region, which would really get us out to a strong start for the month of February, where our normal precipitation in Wilmington is only 2.83″ (February is our driest month on average). Dover and Georgetown’s normal precipitation amounts for February are 3.08″ and 2.58″, respectively. So we only need about 3 inches of precipitation in February to have an above normal month. Here’s the latest 7-day FORECAST precipitation map from the NWS Weather Prediction Center:
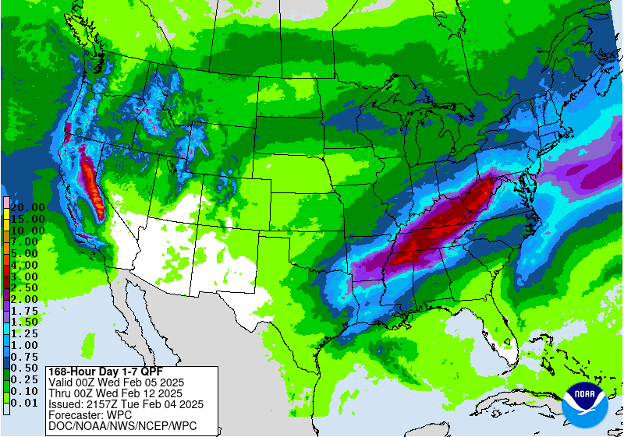
This would definitely put us on the right track in February and perhaps we can break this 6 month, below normal precipitation streak we’ve been on.