April Temperatures
Preliminary data indicates that the statewide average temperature in April was 54.5 °F. This is 0.9 °F above the 1981-2010 normal of 53.6 °F (Figure 1). The slightly warmer than normal conditions in April followed a very cold March that saw temperatures nearly 4 °F below normal.
April Precipitation
Delaware’s statewide precipitation for April 2013 averaged 3.57”, which is 0.15” below the 1981-2010 mean (Figure 2). Although slightly below normal, April 2013 saw 2.71” more precipitation across the First State than April 2012 in which less than one-inch of precipitation fell.
Statewide Spatial Averages
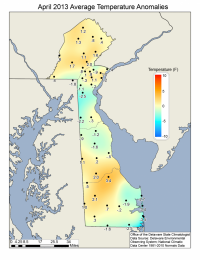
Data from the Delaware Environmental Observing System (DEOS) shows that the mean April station temperatures across Delaware varied significantly with primarily above normal readings across northern Sussex and southern Kent Counties and across much of northern Delaware and Chester County, PA. Southern New Castle, northern Kent and coastal Sussex Counties all experienced below normal temperatures during April (Figure 3).
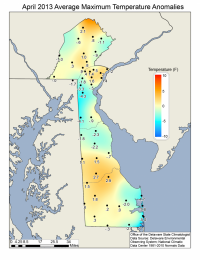
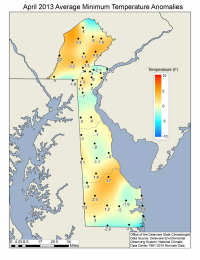
Mean maximum and mean minimum temperatures had a spatial pattern that was broadly similar to the mean temperatures across the state (Figures 4 and 5).
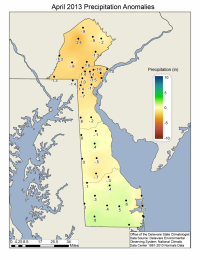
The majority of stations across the state recorded slightly below normal precipitation, except for southern portions of Sussex County where precipitation was just above the 30-year normal (Figure 6).
