Cooler than normal temperatures and above normal rainfall characterized Delaware’s Climate during August 2013.
August Temperatures
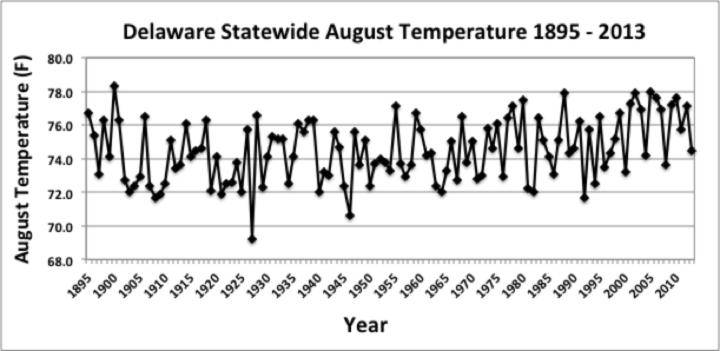
Preliminary data indicates that the statewide average temperature in August was 74.5°F. This is 0.8° F below the 1981-2010 normal of 75.3°F (Figure 1) and marks the second month this year with below normal temperatures (March also had below normal temperature).
August Precipitation
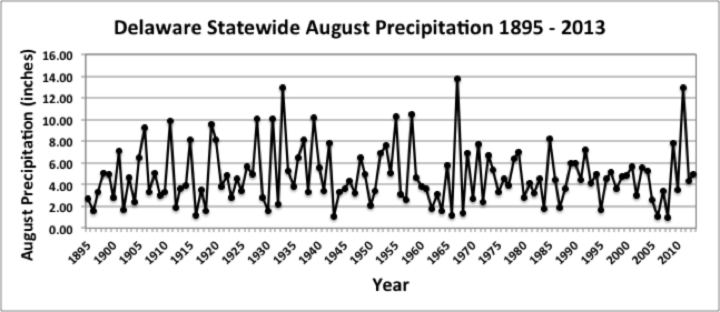
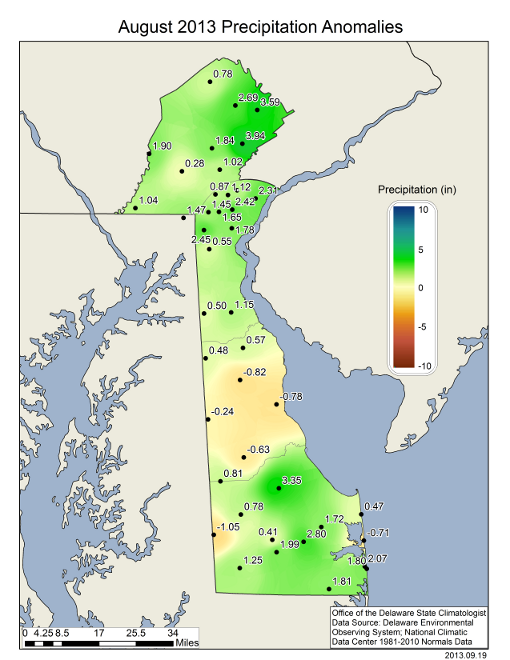
Delaware’s statewide precipitation for August 2013 averaged 4.94”, which is 0.69” above the 1981-2010 mean of 4.25” (Figure 2). Rainfall totals varied across the state ranging from nearly 8” in portions of Sussex County to less than 4” across central portions of Kent County.
Statewide Spatial Averages
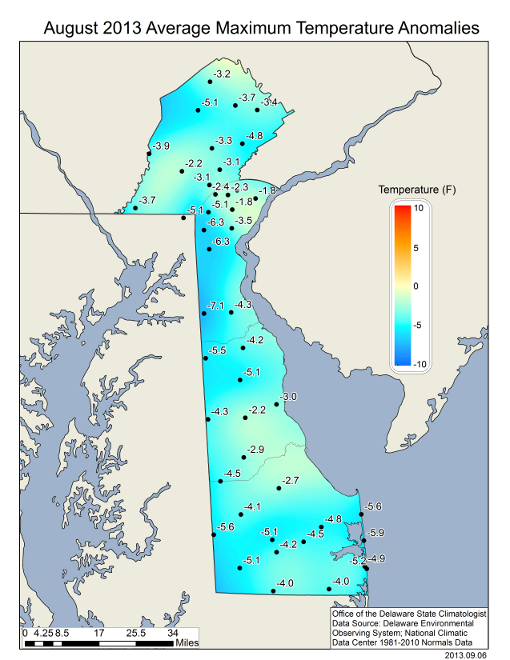
Data from the Delaware Environmental Observing System (DEOS) shows that average August temperatures across Delaware were below normal throughout the entire state with eastern Sussex County and Kent County recording the largest negative anomalies (Figure 3). In general, the magnitude of the cooler than normal conditions increased moving from north to south through Delaware.
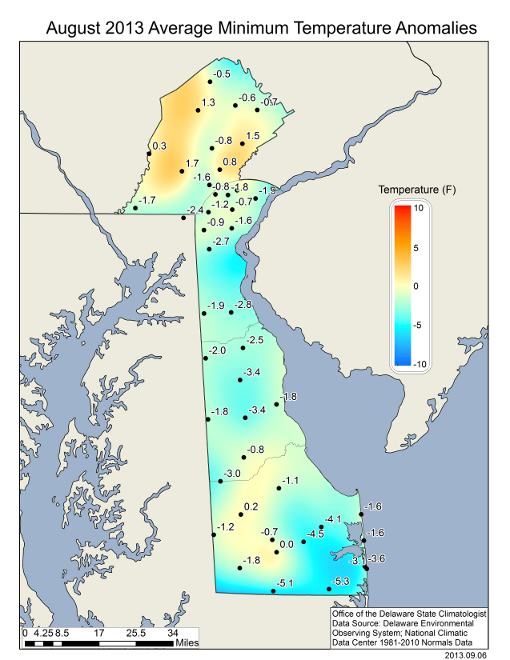
Average maximum temperatures were far below normal for nearly the entire state, while minimum temperatures were cooler than normal in most locations, except across portions of western Sussex County and Chester County, PA where some stations actually recorded warmer than normal minimum temperatures.
Precipitation was above normal across most of the State except for a large area of below normal precipitation in Kent County and far western Sussex County (Figure 6).

Similar Posts
- August 2025 – Very Cool with Below Normal Precipitation Across Delaware (2025)
- August 2024 – Dry with Near Normal Temperature (2024)
- August 2023 – Warm with Below Normal Precipitation Across Delaware (2023)
- August 2022 – Warm and Dry Conditions Persist Across Delaware (2022)
- August 2021 – Continued Warm and Wet Across Delaware (2021)
Climate Office Partners


