Cooler than normal temperatures and near record low rainfall characterized Delaware’s Climate during September 2013.
September Temperatures
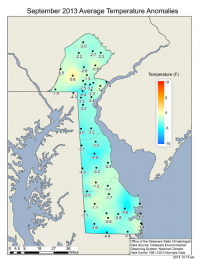
Preliminary data indicates that the statewide average temperature in September was 67.3°F. This is 1.1°F below the 1981-2010 normal of 68.4°F (Figure 1) and marks the second month in a row with below normal temperatures.
September Precipitation
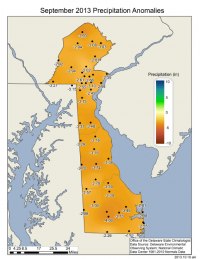
Delaware’s statewide precipitation for September 2013 averaged 0.79”, which is 3.42 inches below the 1981-2010 mean of 4.21” (Figure 2), and the 4th driest September since records began in 1895. September 2013 was the driest month across the State since 0.55” of precipitation fell in February 2009.
Statewide Spatial Averages
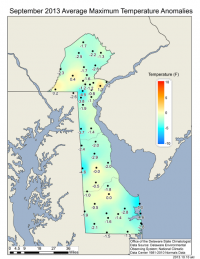
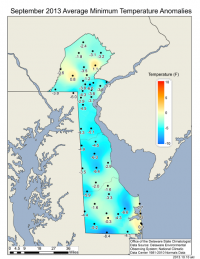
September average monthly temperatures were below normal at nearly all stations in the DEOS (deos.udel.edu) network, with some stations as much as 4°F below the 1981-2010 normal for the month (Figure 3). Average maximum temperatures followed the same general pattern, with particularly large negative anomalies found along coastal regions (Figure 4), while average minimum temperatures were 6°–8°F below normal in some locations (Figure 5).
Precipitation was uniformly low across the entire state with some stations reporting rainfall deficits of up to 4” (Figure 6).


