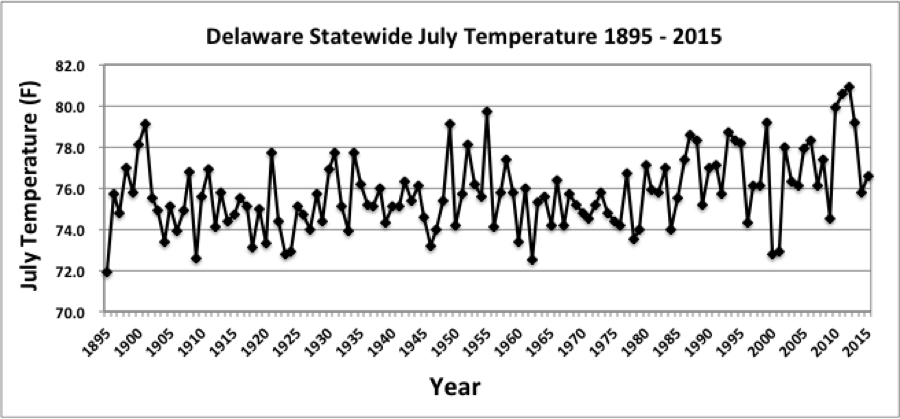

July Temperatures
Preliminary data indicates that the statewide average temperature in July was 76.6°F, equal to the 1981-2010 average for the month (Figure 1). Maximum temperatures averaged 0.9°F below normal, while minimum temperatures averaged 0.9°F above normal across Delaware in July.
July Precipitation
Delaware’s statewide precipitation for July 2015 averaged 3.90 inches, just 0.24 inches below the 1981-2010 mean (Figure 2). July’s near normal precipitation followed a very wet June that ranked as the fourth wettest June since records began in 1895.
Statewide Spatial Averages
Temperatures were near normal across most of the State while the sign and size of anomalies varied from one location to another (Figure 3). Precipitation was below normal across most of Delaware and Chester County, PA except for southern Sussex County and in the Lewes, DE area where strong thunderstorms added to the monthly totals (Figure 4).


Similar Posts
- July 2025 – Very Warm with Above Normal Precipitation Across Delaware (2025)
- July 2024 – Warm with Near Normal Precipitation (2024)
- July 2023 – Warm with Above Normal Precipitation Across Delaware (2023)
- July 2022 – Warm and Dry Conditions Continue Across Delaware (2022)
- July 2021 – Warm and Wet Across Delaware (2021)
Climate Office Partners


