August Temperatures
Preliminary data indicates that the statewide average temperature in August was 74.9°F, equal to the 1981-2010 average for the month (Figure 1). Even with near normal temperatures, August 2015 was the warmest August in the last three years.
August Precipitation
Delaware’s statewide precipitation for August 2015 averaged only 2.81 inches, 1.31 inches below the 1981-2010 mean (Figure 2). August 2015 was the driest August since 2008 across the First State.
DEOS Station Observations
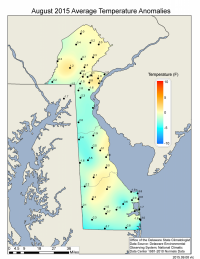
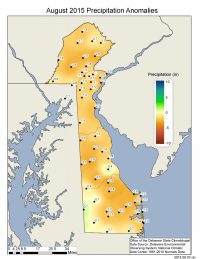
Temperature anomalies varied across the State, with the largest negative departures occurring in Sussex County, and the largest positive departures occurring in the Wilmington area (Figure 3). Precipitation was below normal across nearly the entire State, with deficits of more than two inches found in each County (Figure 4).


