August Temperatures
Preliminary data indicates that the statewide average temperature in August was 74.2°F; this was 0.7°F below the 1981-2010 normal of 74.9°F (Figure 1). August 2017 was the first month of the summer season to register below normal temperatures.
August Precipitation
Delaware’s statewide precipitation for August 2017 averaged 7.25 inches, 3.13 inches above the 1981-2010 mean (Figure 2). August 2017 was the 16th wettest August since records began in 1895.
Statewide Spatial Averages
Data from the Delaware Environmental Observing System (DEOS) show that temperatures were below normal across the entire State with many of the largest negative temperature departures found across the northern portion of the region (Figure 3). The largest precipitation departures were found primarily across southern and central Delaware, where some DEOS stations recorded rainfall that was more than 5 inches above normal for the month (Figure 4).
-
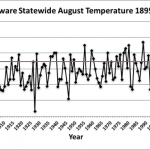
- Figure 1. Delaware statewide mean August temperature (°F) 1895-2017. Red line indicates 1981-2010 normal.
-
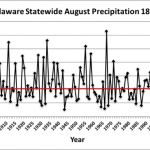
- Figure 2. Delaware statewide August precipitation (inches) 1895-2017. Red line indicates 1981-2010 normal.
-
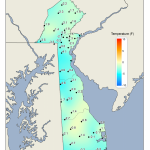
- Figure 3. August 2017 average temperature departures (°F) from the 1981-2010 mean based upon DEOS station data.
-
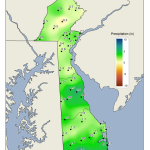
- Figure 4. August 2017 precipitation departures (inches) from the 1981-2010 mean based upon DEOS station data.
Similar Posts
- August 2025 – Very Cool with Below Normal Precipitation Across Delaware (2025)
- August 2024 – Dry with Near Normal Temperature (2024)
- August 2023 – Warm with Below Normal Precipitation Across Delaware (2023)
- August 2022 – Warm and Dry Conditions Persist Across Delaware (2022)
- August 2021 – Continued Warm and Wet Across Delaware (2021)
Climate Office Partners


