August Temperatures
Preliminary data indicates that the statewide average temperature in August was 78.6°F, which is 3.73°F above the 1981-2010 mean value of 74.9°F (Figure 1). August 2018 is tied with August 2016 as the warmest August since records for the State began in 1895. Similar positive temperature anomalies were found across the rest of the northeast United States, and across most of the western and southwestern portions of the country (Figure 2).
August Precipitation
Delaware’s statewide precipitation for August 2018 averaged 4.35inches, 0.22 inches above the 1981-2010 mean (Figure 3). Although statewide totals for August were just above normal, rainfall in southern Delaware was far below normal, while rainfall in the northern portion of the State was far above normal.
Statewide Spatial Averages
Data from the Delaware Environmental Observing System (DEOS) show that temperature (Figure 4) departures were quite large and uniformly positive during August throughout the State. Precipitation departures varied greatly between northern and southern Delaware (Figure 5). Rainfall deficits as large as 4 inches were found in Sussex County, while many locations in northern New Castle County had rainfall surpluses of greater than 5 inches!
-
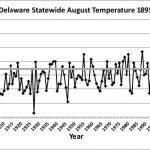
- Figure 1. Delaware statewide mean August temperature (°F) 1895-2018. Gray line indicates 1981-2010 normal.
-
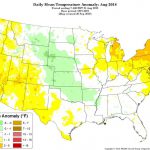
- Figure 2. National daily mean temperature anomalies for August 2018 (from the PRISM Climate Group, OSU).
-
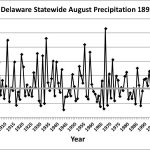
- Figure 3. Delaware statewide August precipitation (inches) 1895-2018. Gray line indicates 1981-2010 normal.
-
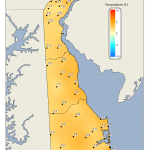
- Figure 4. August 2018 average temperature departures (°F) from the 1981-2010 mean based upon DEOS station data.
-
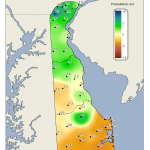
- Figure 5. August 2018 precipitation departures (inches) from the 1981-2010 mean based upon DEOS station data.
Similar Posts
- August 2025 – Very Cool with Below Normal Precipitation Across Delaware (2025)
- August 2024 – Dry with Near Normal Temperature (2024)
- August 2023 – Warm with Below Normal Precipitation Across Delaware (2023)
- August 2022 – Warm and Dry Conditions Persist Across Delaware (2022)
- August 2021 – Continued Warm and Wet Across Delaware (2021)
Climate Office Partners


