February Temperatures
Preliminary data indicates that the statewide average temperature in February was 38.2°F, which is 1.7°F above the 1981-2010 mean value of 36.5°F (Figure 1). This made February 2019 the 30th warmest February in the last 125 years.
February Precipitation
Delaware’s statewide precipitation for February 2019 averaged 3.53 inches, 0.62 inches above the 1981-2010 mean (Figure 2). Like precipitation, snowfall was above normal during the month across northern Delaware with 8.5 inches of snow recorded at the Wilmington – New Castle County Airport (normal is 6.9 inches). Two snowfall events dropped more than 3 inches of snow across the northern half of the State on February 11th and again on the 20th.
Statewide Spatial Averages
Data from the Delaware Environmental Observing System (DEOS) show that temperature departures were above normal across the entire state (Figure 3), while precipitation departures varied depending upon location (Figure 4). Most stations recorded departures of 1 inch or less of liquid precipitation.
National Anomalies
Although temperatures were near normal across Delaware, some areas of the U.S. recorded very large temperature anomalies during February. Specifically, the Dakotas and Montana saw extreme cold with temperatures more than 16°F below normal for the month (Figure 5). This was in stark contrast to temperatures up to 10°F above normal over portions of the southeast U.S. The cold temperatures in the northern Great Plains were accompanied by very large positive precipitation departures in the same area, leading to a thick snow cover (Figure 6).
The February temperature pattern across the United States was the result of a strong negative PNA teleconnection pattern that setup across the country during the month. A negative PNA is associated with a trough (southward displacement) in the jet stream in the western U.S. and a ridge (northward displacement) across the eastern portion of the country (Figure 7).
-
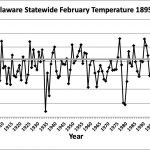
- Figure 1. Delaware statewide mean February temperature (°F) 1895-2019. Gray line indicates 1981-2010 normal.
-
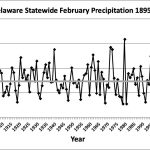
- Figure 2. Delaware statewide February precipitation (inches) 1895-2019. Gray line indicates 1981-2010 normal.
-
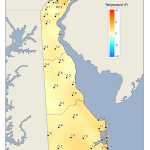
- Figure 3. February 2019 average temperature departures (°F) from the 1981-2010 mean based upon DEOS station data.
-
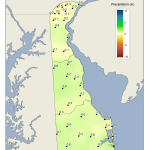
- Figure 4. February 2019 precipitation departures (inches) from the 1981-2010 mean based upon DEOS station data.
-
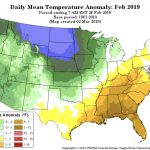
- Figure 5. National daily mean temperature anomalies for February 2019 (from the PRISM Climate Group, OSU).
-
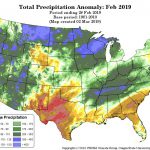
- Figure 6. Total Precipitation Anomaly for February 2019 (from the PRISM Climate Group, OSU).
-
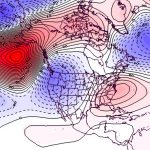
- Figure 7. 500 hPa geopotential height anomalies for February 2019. Negative anomalies indicate the presence of an anomalous trough while positive height anomalies indicate the presence of anomalous ridging.
Similar Posts
- February 2026 – Cold with Near Normal Precipitation Across Delaware (2026)
- February 2025 – Cool with Near Normal Precipitation Across Delaware (2025)
- Winter 2023-2024 – Very Warm and Very Wet Across Delaware (2024)
- February 2024 – Warm and Dry Across Delaware (2024)
- February 2023 – Continued Very Warm with Below Normal Precipitation Across Delaware (2023)
Climate Office Partners


