April Temperatures
Preliminary data indicates that the statewide average temperature in April was 58.0°F, which is 4.5°F above the 1981-2010 mean value of 53.5°F (Figure 1). This places April 2019 as the 2nd warmest since records began in 1895.
April Precipitation
Delaware’s statewide precipitation for April 2019 averaged 3.40 inches, 0.28 inches below the 1981-2010 mean (Figure 2). Delaware’s April precipitation was in the middle one-third of values for the last 125 years.
Statewide Spatial Anomalies
Data from the Delaware Environmental Observing System (DEOS) show that temperature departures were uniformly above normal across the entire state (Figure 3), with many stations seeing anomalies of greater than 4.0°F. Precipitation departures varied depending upon location (Figure 4) with below normal precipitation in the north, and above normal precipitation values across the south.
National Anomalies
Most of the United States saw positive temperature anomalies during April, with the Mid-Atlantic Region and portions of California seeing the largest temperature departures (Figure 5). Much of the country saw above normal precipitation, except for the Great Plains, California and the Southwest (Figure 6).
The 500 hPa height pattern for April showed anomalous ridging of the jet stream over our region leading to enhanced southerly flow and higher than normal temperatures (Figure 7).
-
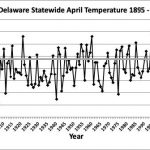
- Figure 1. Delaware statewide mean April temperature (°F) 1895-2019. Gray line indicates 1981-2010 normal.
-
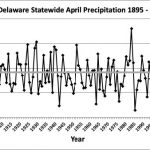
- Figure 2. Delaware statewide April precipitation (inches) 1895-2019. Gray line indicates 1981-2010 normal.
-
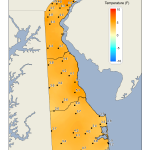
- Figure 3. April 2019 average temperature departures (°F) from the 1981-2010 mean based upon DEOS station data.
-
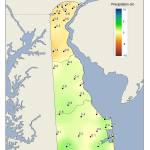
- Figure 4. April 2019 precipitation departures (inches) from the 1981-2010 mean based upon DEOS station data.
-
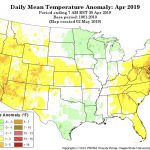
- Figure 5. National daily mean temperature anomalies for April 2019 (from the PRISM Climate Group, OSU).
-
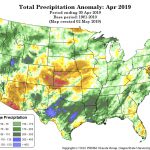
- Figure 6. Total Precipitation Anomaly for April 2019 (from the PRISM Climate Group, OSU).
-
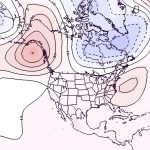
- Figure 7. 500 hPa geopotential height anomalies for April 2019. Negative (blue) anomalies indicate the presence of an anomalous jet stream trough while positive (red) height anomalies indicate the presence of anomalous ridging.
Similar Posts
- April 2025 – Warm with Near Normal Precipitation Across Delaware (2025)
- April 2024 – Warm and Dry Across Delaware (2024)
- April 2023 – Very Warm with Above Normal Precipitation Across Delaware (2023)
- April 2022 – Cool and Wet Conditions Prevail Across Delaware (2022)
- April 2021 – Warm with Below Normal Precipitation Across Delaware (2021)
Climate Office Partners


