May Temperatures
Preliminary data indicates that the statewide average temperature in May was 66.6°F, which is 3.9°F above the 1981-2010 mean value of 62.7°F (Figure 1). This places May 2019 as the 7th warmest since records began in 1895, tied with the years 1896 and 1944 in that position.
May Precipitation
Delaware’s statewide precipitation for May 2019 averaged 4.92 inches, 1.06 inches above the 1981-2010 mean (Figure 2). Delaware’s May precipitation was in the top 0ne-third of values for the last 125 years.
Statewide Spatial Anomalies
Data from the Delaware Environmental Observing System (DEOS) show that temperature departures were uniformly above normal across the entire state (Figure 3), with some stations seeing anomalies of greater than 3.0°F. Precipitation departures were generally above normal across the state (Figure 4) with the largest positive precipitation anomalies found across northern New Castle County.
National Anomalies
The United States saw both positive and negative temperature anomalies during May, with the Southeast, mid-Atlantic and the Pacific Northwest seeing above normal temperatures (Figure 5). Wet conditions were prevalent across the Great Plains, California and parts of the Southwest, while the Southeast was quite dry (Figure 6).
The 500 hPa height pattern for May showed anomalous ridging of the jet stream over our region leading to enhanced southerly flow and higher than normal temperatures (Figure 7).
-
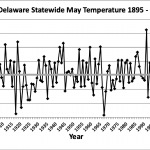
- Figure 1. Delaware statewide mean May temperature (°F) 1895-2019. Gray line indicates 1981-2010 normal.
-
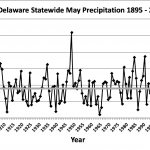
- Figure 2. Delaware statewide May precipitation (inches) 1895-2019. Gray line indicates 1981-2010 normal.
-

- Figure 3. May 2019 average temperature departures (°F) from the 1981-2010 mean based upon DEOS station data.
-
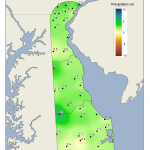
- Figure 4. May 2019 precipitation departures (inches) from the 1981-2010 mean based upon DEOS station data.
-
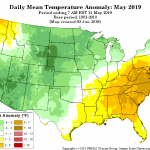
- Figure 5. National daily mean temperature anomalies for May 2019 (from the PRISM Climate Group, OSU).
-
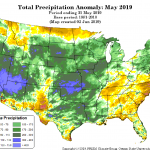
- Figure 6. Total Precipitation Anomaly for May 2019 (from the PRISM Climate Group, OSU).
-
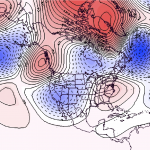
- Figure 7. 500 hPa geopotential height anomalies for May 2019. Negative (blue) anomalies indicate the presence of an anomalous jet stream trough while positive (red) height anomalies indicate the presence of anomalous ridging.
Similar Posts
Climate Office Partners


