August Temperatures
Preliminary data indicates that the statewide average temperature in August was 76.8°F, which is 1.9°F above the 1981-2010 mean value of 74.9°F (Figure 1). This places August 2019 as the 13th warmest since records began in 1895, tied with August 2012.
August Precipitation
Delaware’s statewide precipitation for August 2019 averaged 3.78 inches, 0.35 inches below the 1981-2010 mean (Figure 2). Delaware’sAugust precipitation was in the middle 0ne-third of values for the last 125 years, putting it into the “normal” range for this month.
Statewide Spatial Anomalies
Data from the Delaware Environmental Observing System (DEOS) show that temperature departures were above normal throughout most of the State (Figure 3), with the exception of western Kent County. There was a mixture of positive and negative precipitation departures observed across the State (Figure 4). In general, northern New Castle County saw much below normal precipitation, while a few stations in Kent and Sussex Counties actually recorded above normal precipitation amounts. This pattern of precipitation anomalies is a result of the highly localized nature of convective (thunderstorm) rainfall events during the summer months.
National Anomalies
The western United States experienced above normal temperatures during August, with below normal temperatures found mainly across the north-central portion of the country (Figure 5). Precipitation anomalies across the U.S. varied greatly, with above normal rainfall across much of the High Plains and below normal precipitation across California and the southwest (Figure 6). The 500 hPa height pattern for August showed a weak anomalous trough over the north-central portion of the Country (Figure 7), bringing the cool temperatures to that region.
-
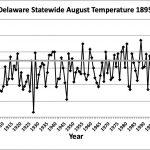
- Figure 1. Delaware statewide mean August temperature (°F) 1895-2019. Gray line indicates 1981-2010 normal.
-
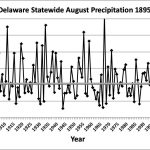
- Figure 2. Delaware statewide August precipitation (inches) 1895-2019. Gray line indicates 1981-2010 normal.
-
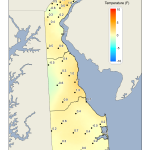
- Figure 3. August 2019 average temperature departures (°F) from the 1981-2010 mean based upon DEOS station data.
-
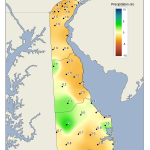
- Figure 4. August 2019 precipitation departures (inches) from the 1981-2010 mean based upon DEOS station data.
-
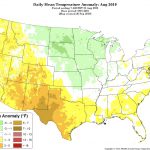
- Figure 5. National daily mean temperature anomalies for August 2019 (from the PRISM Climate Group, OSU).
-
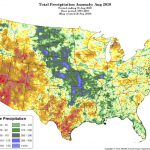
- Figure 6. Total Precipitation Anomaly for August 2019 (from the PRISM Climate Group, OSU).
-
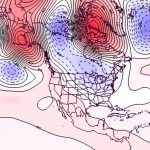
- Figure 7. 500 hPa geopotential height anomalies for August 2019. Negative (blue) anomalies indicate the presence of an anomalous jet stream trough while positive (red) height anomalies indicate the presence of anomalous ridging.
Similar Posts
- August 2025 – Very Cool with Below Normal Precipitation Across Delaware (2025)
- August 2024 – Dry with Near Normal Temperature (2024)
- August 2023 – Warm with Below Normal Precipitation Across Delaware (2023)
- August 2022 – Warm and Dry Conditions Persist Across Delaware (2022)
- August 2021 – Continued Warm and Wet Across Delaware (2021)
Climate Office Partners


