September Temperatures
Preliminary data indicates that the statewide average temperature in September was 71.1°F, which is 3.7°F above the 1981-2010 mean value of 68.0°F (Figure 1). This places September 2019 as the 9th warmest since records began in 1895.
September Precipitation
Delaware’s statewide precipitation for September 2019 averaged 1.15 inches, 2.82 inches below the 1981-2010 mean (Figure 2). September 2019 was the 9th driest on record since 1895.
Statewide Spatial Anomalies
Data from the Delaware Environmental Observing System (DEOS) show that temperature departures were above normal throughout the State (Figure 3), with the largest positive anomalies found across northern New Castle County. Precipitation was below normal at every station (Figure 4), with the largest negative anomalies found across New Castle County, where some stations recorded precipitation totals more than 4 inches below the September normal.
National Anomalies
Temperatures were far above normal throughout most of the eastern two-thirds of the U.S, where some positive anomalies reached greater than 7°F (Figure 5). In general, precipitation was below normal across the eastern U.S. and much of the country’s southern tier. Only the northern Great Plains and Pacific Northwest saw significantly above normal precipitation (Figure 6). The 500 hPa height pattern for September showed an anomalous ridge over the eastern U.S. (Figure 7), bringing the warm temperatures to that region.
-
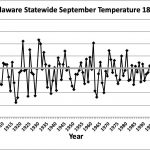
- Figure 1. Delaware statewide mean September temperature (°F) 1895-2019. Gray line indicates 1981-2010 normal.
-
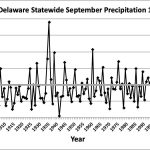
- Figure 2. Delaware statewide September precipitation (inches) 1895-2019. Gray line indicates 1981-2010 normal.
-
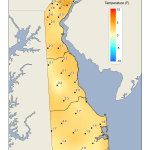
- Figure 3. September 2019 average temperature departures (°F) from the 1981-2010 mean based upon DEOS station data.
-
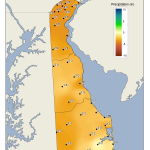
- Figure 4. September 2019 precipitation departures (inches) from the 1981-2010 mean based upon DEOS station data.
-
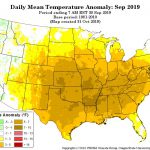
- Figure 5. National daily mean temperature anomalies for September 2019 (from the PRISM Climate Group, OSU).
-
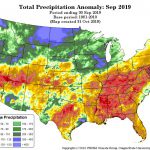
- Figure 6. Total Precipitation Anomaly for September 2019 (from the PRISM Climate Group, OSU).
-
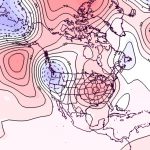
- Figure 7. 500 hPa geopotential height anomalies for September 2019. Negative (blue) anomalies indicate the presence of an anomalous jet stream trough while positive (red) height anomalies indicate the presence of anomalous ridging.
Similar Posts
- September 2025 – Warm with Below Normal Precipitation Across Delaware (2025)
- September 2024 – Very Dry with Near Normal Temperatures (2024)
- September 2023 – Warm with Above Normal Precipitation Across Delaware (2023)
- September 2022 – Near Normal Temperatures and Dry Conditions Across Delaware (2022)
- September 2021 – Warm with Near Normal Precipitation Across Delaware (2021)
Climate Office Partners


