April Temperatures
Preliminary data indicates that the statewide average temperature in April was 52.4o F, which is 1.1o F below the 1981-2010 mean value of 53.5o F (Figure 1). April 2020 was the first month with below normal temperatures since November 2019.
April Precipitation
Delaware’s statewide precipitation for April 2020 averaged 4.09 inches, 0.45 inches above the 1981-2010 mean (Figure 2). This placed the April 2020 precipitation amount in the top one-third of all years since 1895.
Statewide Spatial Anomalies
Data from the Delaware Environmental Observing System (DEOS) show that temperature departures were below normal throughout the State (Figure 3), with most stations between 2o and 4o F below the 30-year mean. Precipitation was above normal at all locations, with the largest positive anomalies of between one and two inches across Kent and New Castle Counties (Figure 4).
National Anomalies
Temperatures were below normal across the eastern two-thirds of the U.S., except near the Gulf Coast states. Departures were generally between 1o to 5o F below normal in this area. Positive temperature anomalies were found across much of the western and southwestern portions of the United States (Figure 5). Precipitation was generally above normal in the eastern one-third of the United States and below normal across the west, except for large positive anomalies across southern California (Figure 6). The 500 hPa height pattern for April showed a strong trough dominating the eastern two-thirds of the country (Figure 7) leading to the cooler temperatures across our region.
-
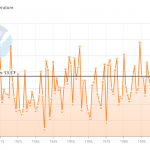
- Figure 1. Delaware statewide mean April temperature (oF) 1895-2020. Black line indicates 1981-2010 normal (NOAA, NCEI, Climate at a Glance: Statewide Time Series).
-
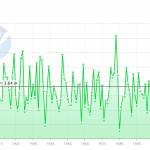
- Figure 2. Delaware statewide April precipitation (inches) 1895-2020. Black line indicates 1981-2010 normal (NOAA, NCEI, Climate at a Glance: Statewide Time Series).
-
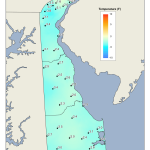
- Figure 3. April 2020 average temperature departures (oF) from the 1981-2010 mean based upon DEOS station data.
-
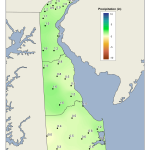
- Figure 4. April 2020 precipitation departures (inches) from the 1981-2010 mean based upon DEOS station data.
-
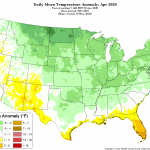
- Figure 5. National daily mean temperature anomalies for April 2020 (from the PRISM Climate Group, OSU).
-
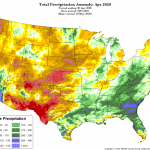
- Figure 6. Total Precipitation Anomaly for April 2020 (from the PRISM Climate Group, OSU).
-
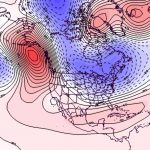
- Figure 7. 500 hPa geopotential height anomalies for April 2020. Negative (blue) anomalies indicate the presence of an anomalous jet stream trough while positive (red) height anomalies indicate the presence of an anomalous jet stream ridge.
Similar Posts
- April 2026 – Very Warm and Dry Across Delaware (2026)
- April 2025 – Warm with Near Normal Precipitation Across Delaware (2025)
- April 2024 – Warm and Dry Across Delaware (2024)
- April 2023 – Very Warm with Above Normal Precipitation Across Delaware (2023)
- April 2022 – Cool and Wet Conditions Prevail Across Delaware (2022)
Climate Office Partners


