September Temperatures
Preliminary data indicates that the statewide average temperature in September was 71.0o F, which is 3.0o F above the 1981-2010 mean value of 68.0o F (Figure 1). This month’s statewide temperature was tied with 1925 as the 13th warmest September since observations began in 1895.
September Precipitation
Delaware’s statewide precipitation for September 2021 averaged 4.04 inches, 0.07 inches above the 1981-2010 mean (Figure 2). This placed this month’s precipitation total in the normal range of all years since 1895.
Statewide Spatial Anomalies
Data from the Delaware Environmental Observing System (DEOS) show that temperature departures were above normal across the entire State, with the exception of southwestern Sussex County (Figure 3). Precipitation anomalies varied across the State with large positive precipitation anomalies found in northern New Castle County. The largest negative anomalies were found along coastal areas of Sussex County (Figure 4).
National Anomalies
Temperatures were above normal across most of the United States, with the largest temperature anomalies found across the Great Plains and New England. Precipitation anomalies varied greatly across the country with dry conditions across much of the western United States except for Oregon and Washington and portions of the Desert Southwest (Figure 6). Wet conditions were found across much of eastern Pennsylvania and southern New England. The 500 hPa height pattern for September shows a weak jet stream ridge located over the western United States except for the Pacific northwest. This jet stream pattern contributed to the generally warm and dry pattern found across that region (Figure 7).
-
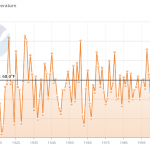
- Figure 1. Delaware statewide mean September temperature (oF) 1895-2021. Black line indicates 1981-2010 normal (NOAA, NCEI, Climate at a Glance: Statewide Time Series).
-
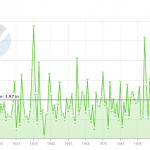
- Figure 2. Delaware statewide September precipitation (inches) 1895-2021. Black line indicates 1981-2010 normal (NOAA, NCEI, Climate at a Glance: Statewide Time Series).
-
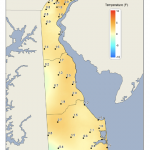
- Figure 3. September 2021 average temperature departures (oF) from the 1981-2010 mean based upon DEOS station data.
-
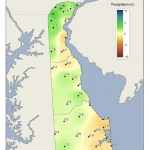
- Figure 4. September 2021 precipitation departures (inches) from the 1981-2010 mean based upon DEOS station data.
-
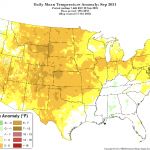
- Figure 5. National daily mean temperature anomalies for September 2021 (from the PRISM Climate Group, OSU).
-
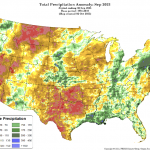
- Figure 6. Total precipitation anomaly for September 2021 (from the PRISM Climate Group, OSU).
-
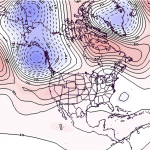
- Figure 7. 500 hPa geopotential height anomalies for September 2021. Negative (blue) anomalies indicate the presence of an anomalous jet stream trough while positive (red) height anomalies indicate the presence of an anomalous jet stream ridge.
Similar Posts
- September 2025 – Warm with Below Normal Precipitation Across Delaware (2025)
- September 2024 – Very Dry with Near Normal Temperatures (2024)
- September 2023 – Warm with Above Normal Precipitation Across Delaware (2023)
- September 2022 – Near Normal Temperatures and Dry Conditions Across Delaware (2022)
- September 2020 – Near Normal Temperature and Precipitation Across Delaware (2020)
Climate Office Partners


