October Temperatures
Preliminary data indicates that the statewide average temperature in October was 63.9o F, which is 6.8o F above the 1981-2010 mean value of 57.1o F (Figure 1). October’s average temperature was the second highest recorded since observations began in 1895. Only October 2007 has seen a higher mean temperature.
October Precipitation
Delaware’s statewide precipitation for October 2021 averaged 3.65 inches, 0.19 inches above the 1981-2010 mean (Figure 2). This placed this month’s precipitation total in the normal range of all years since 1895.
Statewide Spatial Anomalies
Data from the Delaware Environmental Observing System (DEOS) show that temperature departures were far above normal across the entire State, with many stations seeing positive temperature anomalies of greater than 6o F (Figure 3). Precipitation anomalies varied across the State with mostly positive precipitation anomalies found across Kent and New Castle Counties, and mixed anomalies across Sussex County (Figure 4).
National Anomalies
Temperatures were much above normal across the eastern two-thirds of the United States, with the largest positive temperature anomalies found across the Great Lakes and Northeast regions. Much of the Pacific Coast and the Southwest experienced below normal temperatures during the month (Figure 5). Precipitation anomalies varied greatly across the country (Figure 6), with excessively heavy precipitation falling in northern California. The 500 hPa height pattern for October shows a very strong jet stream ridge located over eastern North America contributing to the extreme warmth across that region (Figure 7).
-
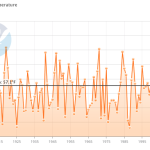
- Figure 1. Delaware statewide mean October temperature (°F) 1895-2021. Black line indicates 1981-2010 normal (NOAA, NCEI, Climate at a Glance: Statewide Time Series).
-
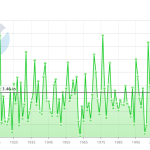
- Figure 2. Delaware statewide October precipitation (inches) 1895-2021. Black line indicates 1981-2010 normal (NOAA, NCEI, Climate at a Glance: Statewide Time Series).
-
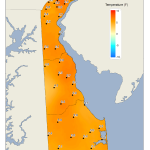
- Figure 3. October 2021 average temperature departures (°F) from the 1981-2010 mean based upon DEOS station data.
-
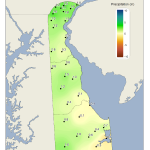
- Figure 4. October 2021 precipitation departures (inches) from the 1981-2010 mean based upon DEOS station data.
-
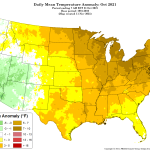
- Figure 5. National daily mean temperature anomalies for October 2021 (from the PRISM Climate Group, OSU).
-
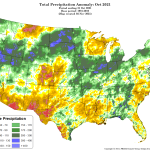
- Figure 6. Total precipitation anomaly for October 2021 (from the PRISM Climate Group, OSU).
-
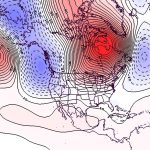
- Figure 7. 500 hPa geopotential height anomalies for October 2021. Negative (blue) anomalies indicate the presence of an anomalous jet stream trough while positive (red) height anomalies indicate the presence of an anomalous jet stream ridge.
Similar Posts
- October 2025 – Near Normal Temperatures with Below Normal Precipitation Across Delaware (2025)
- October 2024 – Record Dry Conditions with Near Normal Temperatures (2024)
- October 2023 – Warm and Dry Across Delaware (2023)
- October 2022 – Below Normal Temperatures and Near Normal Precipitation Across Delaware (2022)
- October 2020 – Warm and Wet Across Delaware (2020)
Climate Office Partners


