November Temperatures
Preliminary data indicates that the statewide average temperature in November was 45.6°F, which is 1.9°F below the 1991-2020 mean value of 47.5°F (Figure 1). November’s average temperature was the first month with below normal temperatures since February of 2021.
November Precipitation
Delaware’s statewide precipitation for November 2021 averaged 1.02 inches, 2.25 inches below the 1991-2020 mean (Figure 2). This placed this month’s precipitation as the 13th lowest November precipitation since records began in 1895.
Statewide Spatial Anomalies
Data from the Delaware Environmental Observing System (DEOS) show that temperature departures were uniformly below normal across the entire State, with many stations seeing negative temperature anomalies of between 2°F and 3°F (Figure 3). Precipitation was below normal across the entire state with some stations reaching negative anomalies of greater than 4 inches (Figure 4).
National Anomalies
Temperatures were below normal across most of the eastern one-third of the United States, with the largest negative temperature anomalies found across the Ohio River Basin. The western two-thirds of the United States saw significantly above normal temperatures, with some anomalies reaching as much as 7°F to 10°F above normal across the Rocky Mountain states (Figure 5). Precipitation anomalies varied greatly across the country (Figure 6), with excessively dry conditions across much of the country except for Florida and the state of Washington. The 500 hPa height pattern for November shows a strong jet stream trough located over eastern North America and a strong jet stream ridge over western North America contributing to the temperature extremes across those regions (Figure 7).
-
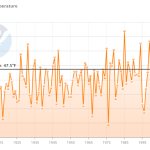
- Figure 1. Delaware statewide mean November temperature (°F) 1895-2021. Black line indicates 1991-2020 normal (NOAA, NCEI, Climate immediately: Statewide Time Series).
-
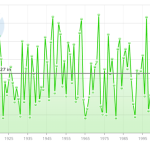
- Figure 2. Delaware statewide November precipitation (inches) 1895-2021. Black line indicates 1991-2020 normal (NOAA, NCEI, Climate at a Glance: Statewide Time Series).
-
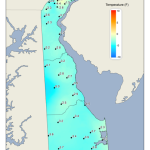
- Figure 3. November 2021 average temperature departures (°F) from the 1981-2010 mean based upon DEOS station data.
-
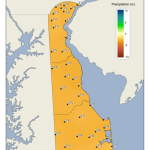
- Figure 4. November 2021 precipitation departures (inches) from the 1981-2010 mean based upon DEOS station data.
-
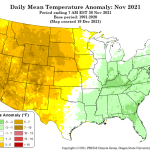
- Figure 5. National daily mean temperature anomalies for November 2021 (from the PRISM Climate Group, OSU).
-
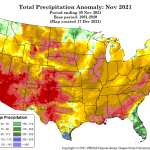
- Figure 6. Total precipitation anomaly for November 2021 (from the PRISM Climate Group, OSU).
-
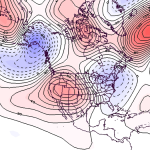
- Figure 7. 500 hPa geopotential height anomalies for November 2021. Negative (blue) anomalies indicate the presence of an anomalous jet stream trough while positive (red) height anomalies indicate the presence of an anomalous jet stream ridge.
Similar Posts
- November 2025 – Cool and Very Dry Across Delaware (2025)
- November 2024 – Very Warm and Dry Across Delaware (2024)
- November 2023 – Cool and Dry Across Delaware (2023)
- November 2022 – Warm with Near Normal Precipitation Across Delaware (2022)
- November 2020 – Exceptionally Warm and Wet Across Delaware (2020)
Climate Office Partners


