November Temperatures
Preliminary data indicates that the statewide average temperature in November was 51.2°F, which is 3.7°F above the 1991-2020 mean value of 47.5°F (Figure 1). November’s temperature was the 7th warmest since records began in 1895.
November Precipitation
Delaware’s statewide precipitation for November 2024 averaged 1.96 inches, 1.31 inches below the 1991-2020 mean of 3.27 inches (Figure 2). November’s precipitation totaled more than twice the amount that fell during September and October combined. However, November 2024 still ranked in the bottom one-third for precipitation since 1895.
Statewide Spatial Anomalies
Data from the Delaware Environmental Observing System (DEOS) show that temperature departures were uniformly positive across the State, with anomalies of 3° to 5°F across much of New Castle County (Figure 3). Precipitation anomalies were negative across the entire state, with Sussex County seeing the largest negative departures for the month (Figure 4).
National Anomalies
Temperatures were above normal across the entire eastern United States in November (Figure 5), with locations in the north-central and south-central U.S. seeing departures between 7° and 9°F. Much of the western portions of the country saw below normal temperatures. Precipitation was below normal along the Atlantic Coast (Figure 6), while much of the central U.S. and the Pacific coast saw higher than normal precipitation amounts. The 500 hPa height pattern for November showed an anomalous jet stream ridge across the eastern United States and a trough in the west (Figure 7) contributing to the temperature anomalies across the country.
Global Anomalies
November 2024 ranked as the second warmest November on record for the globe since 1850. Global temperatures were 2.41°F above the 1901-2000 mean. Particular warmth was found across Asia which had its warmest November on record (Figure 8).
-
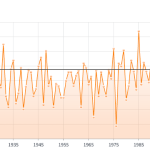
- Figure 1. Delaware statewide mean November temperature (degrees F) 1895-2024. The black line indicates the 1991-2020 normal (NOAA, NCEI, Climate at a Glance: Statewide Time Series).
-
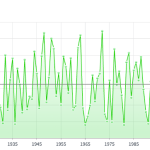
- Figure 2. Delaware statewide November precipitation (inches) 1895-2024. The Black line indicates the 1991-2020 normal (NOAA, NCEI, Climate at a Glance: Statewide Time Series).
-
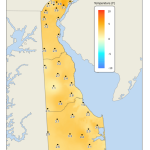
- Figure 3. November 2024 average temperature departures (degrees F) from the 1991-2020 mean based upon DEOS station data.
-
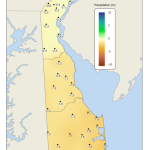
- Figure 4. November 2024 precipitation departures (inches) from the 1991-2020 mean based upon DEOS station data.
-
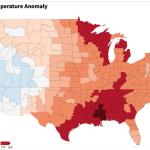
- Figure 5. United States climate division temperature anomalies (degrees F) for November 2024 (NOAA, NCEI, Climate at a Glance: Divisional Mapping).
-
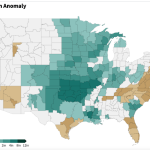
- Figure 6. United States climate division precipitation anomalies (inches) for November 2024 (NOAA, NCEI, Climate at a Glance: Divisional Mapping).
-
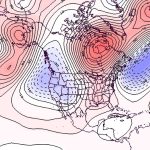
- Figure 7. 500 hPa geopotential height anomalies for November 2024. Negative (blue) anomalies indicate the presence of an anomalous jet stream trough while positive (red) height anomalies indicate the presence of an anomalous jet stream ridge.
-
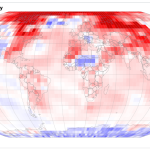
- Figure 8. Global temperature anomalies (degrees C) for November 2024 (NOAA, NCEI, Climate at a Glance: Global Mapping).
Similar Posts
- November 2025 – Cool and Very Dry Across Delaware (2025)
- November 2023 – Cool and Dry Across Delaware (2023)
- November 2022 – Warm with Near Normal Precipitation Across Delaware (2022)
- November 2021 – Below Normal Temperatures and Precipitation Across Delaware (2021)
- November 2020 – Exceptionally Warm and Wet Across Delaware (2020)
Climate Office Partners


