February Temperatures
Preliminary data indicates that the statewide average temperature in February was 39.2o F, which is 2.1o F above the 1991-2020 mean value of 37.1o F (Figure 1). February 2022 was tied with February 2000 as the 19th warmest since observations began in 1895.
February Precipitation
Delaware’s statewide precipitation for February 2022 averaged 2.03 inches, 0.88 inches below the 1991-2020 mean (Figure 2). This placed this month’s precipitation as the 28th driest February precipitation total since records began in 1895.
Statewide Spatial Anomalies
Data from the Delaware Environmental Observing System (DEOS) show that temperature departures were uniformly above normal across the entire State, with many stations seeing positive temperature anomalies of greater than 3o F (Figure 3). Precipitation was below normal across the entire state, with the largest negative departures found across Sussex County (Figure 4). A snowfall event on February 13th dropped between one and two inches of snow across northern Delaware.
National Anomalies
Temperatures were above normal across the Atlantic Coast of the United States, with the largest positive temperature anomalies found across the Carolinas. The central portions of the country saw much below normal temperatures with some negative departures as much as 10o F across northern Minnesota (Figure 5). Precipitation anomalies varied greatly across the country (Figure 6), with dry conditions across areas west of the Rocky Mountains. Wet conditions were found across the Ohio Valley and the Northeast regions. The 500 hPa height pattern for February shows a strong jet stream trough located over central North America and a strong jet stream ridge over both the eastern and western United States contributing to the temperature extremes across those regions (Figure 7).
-
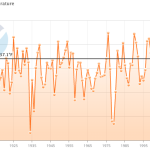
- Figure 1. Delaware statewide mean February temperature (°F) 1895-2022. Black line indicates 1991-2020 normal (NOAA, NCEI, Climate immediately: Statewide Time Series).
-
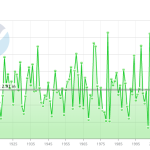
- Figure 2. Delaware statewide February precipitation (inches) 1895-2022. Black line indicates 1991-2020 normal (NOAA, NCEI, Climate at a Glance: Statewide Time Series).
-
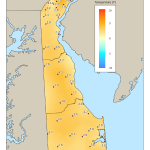
- Figure 3. February 2022 average temperature departures (°F) from the 1991-2020 mean based upon DEOS station data.
-
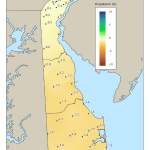
- Figure 4. February 2022 precipitation departures (inches) from the 1991-2020 mean based upon DEOS station data.
-
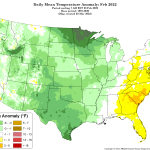
- Figure 5. National daily mean temperature anomalies for February 2022 (from the PRISM Climate Group, OSU).
-
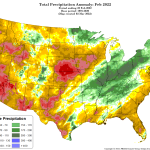
- Figure 6. Total precipitation anomaly for February 2022 (from the PRISM Climate Group, OSU).
-
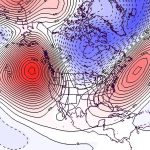
- Figure 7. 500 hPa geopotential height anomalies for February 2022. Negative (blue) anomalies indicate the presence of an anomalous jet stream trough while positive (red) height anomalies indicate the presence of an anomalous jet stream ridge.
Similar Posts
- February 2026 – Cold with Near Normal Precipitation Across Delaware (2026)
- February 2025 – Cool with Near Normal Precipitation Across Delaware (2025)
- Winter 2023-2024 – Very Warm and Very Wet Across Delaware (2024)
- February 2024 – Warm and Dry Across Delaware (2024)
- February 2023 – Continued Very Warm with Below Normal Precipitation Across Delaware (2023)
Climate Office Partners


