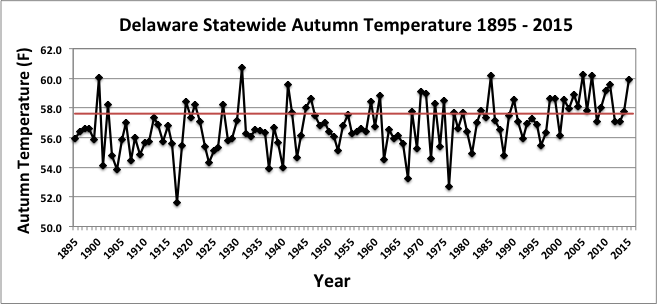
Autumn Temperatures
Preliminary data indicates that autumn temperatures were appreciably above the 30-year “normal” during 2015. The statewide mean autumn temperature of 59.9°F was 2.3°F above the 1981-2010 mean value of 57.6°F (Figure 1). This made autumn of 2015 the sixth warmest since records began in 1895.
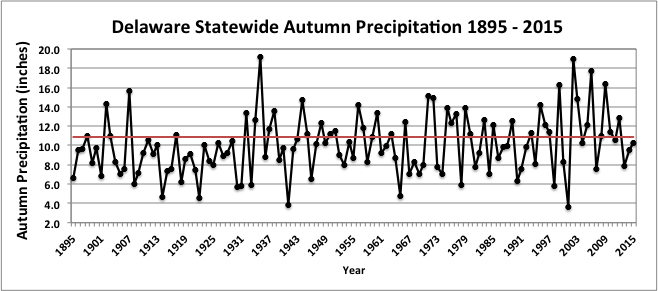
Autumn Precipitation
The statewide mean precipitation of 10.30 inches was 0.53 inches below the 1981-2010 normal of 10.83 inches, and was the 3rd year in a row with below normal Autumn rainfall (Figure 2).
Statewide Spatial Averages
Data from the Delaware Environmental Observing System (DEOS) show that autumn temperatures across the entire State were above normal, except for a few stations in southern Sussex County and northern Kent County (Figure 3). Northern Delaware and Chester County, PA saw the largest positive temperature anomalies reaching greater than 3°F at several stations.
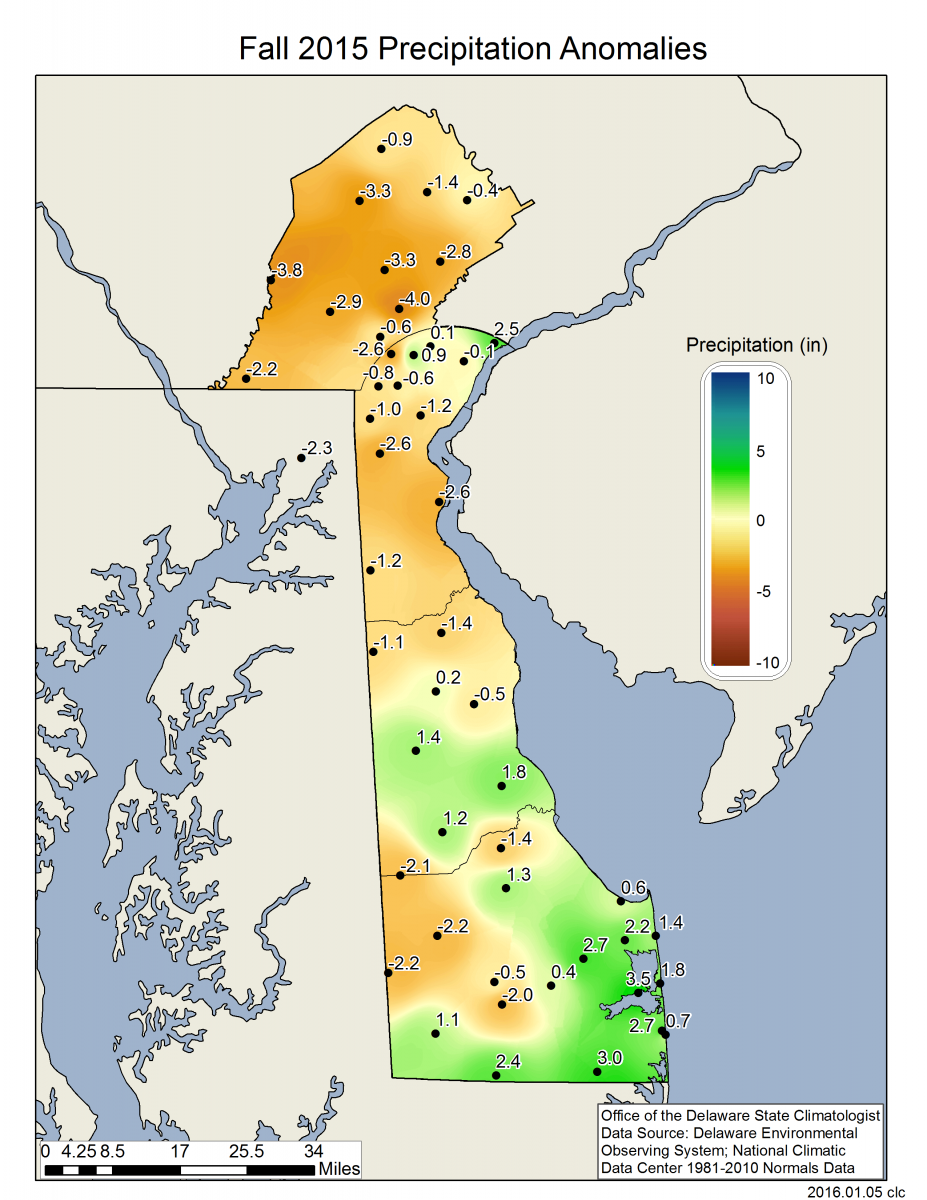
Autumn rainfall varied significantly across the State depending upon location. In general, the heaviest precipitation fell across coastal and southern Sussex County, while portions of northern Delaware and Chester County, PA saw the largest negative rainfall departures (Figure 4).

Similar Posts
- November 2025 – Cool and Very Dry Across Delaware (2025)
- October 2025 – Near Normal Temperatures with Below Normal Precipitation Across Delaware (2025)
- September 2025 – Warm with Below Normal Precipitation Across Delaware (2025)
- November 2024 – Very Warm and Dry Across Delaware (2024)
- October 2024 – Record Dry Conditions with Near Normal Temperatures (2024)
Climate Office Partners


