Kayaking in DE

Record Rainfall and Warm Temperatures Across Delaware in June 2013

Record rainfall and warmer than normal conditions characterized Delaware’s Climate during June 2013.

de_statewideJuneTemp-1895-2013_0.png

Figure 1. Delaware statewide mean June temperature (°F) 1895-2013.
de_statewideJunePrecip-1895-2013_0.png

Figure 2. Delaware statewide June precipitation (inches) 1895-2013.

June Temperatures

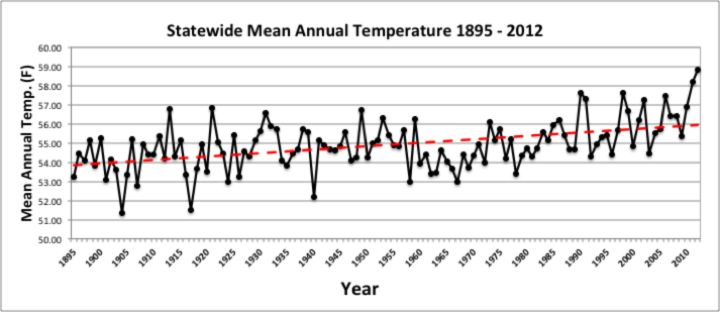
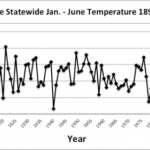
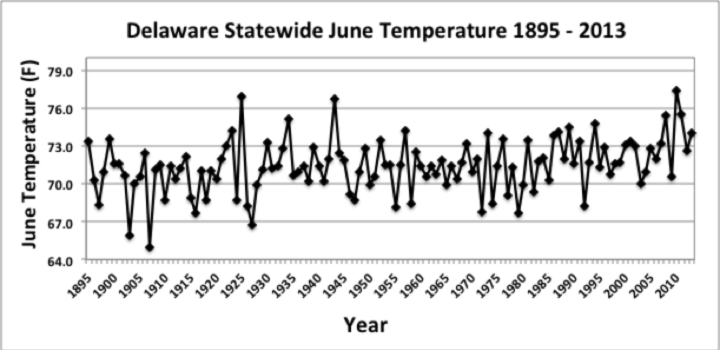
Preliminary data indicates that the statewide average temperature in June was 74° F. This is 1.6° F above the 1981-2010 normal of 72.4°F (Figure 1) and the 4th straight June with above normal temperatures.

June Precipitation

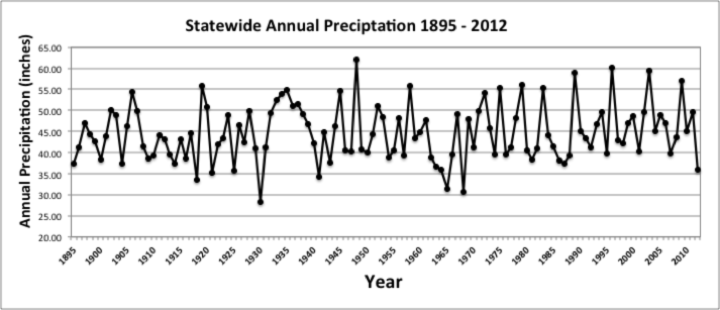
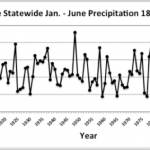
Delaware’s statewide precipitation for June 2013 averaged 10.94”, which is 7.08” above the 1981-2010 mean of 3.86” (Figure 2). The 10.94” that fell in June represents a new statewide rainfall record for the month. In addition, Wilmington set a new June precipitation record recording 13.66”.

Statewide Spatial Averages

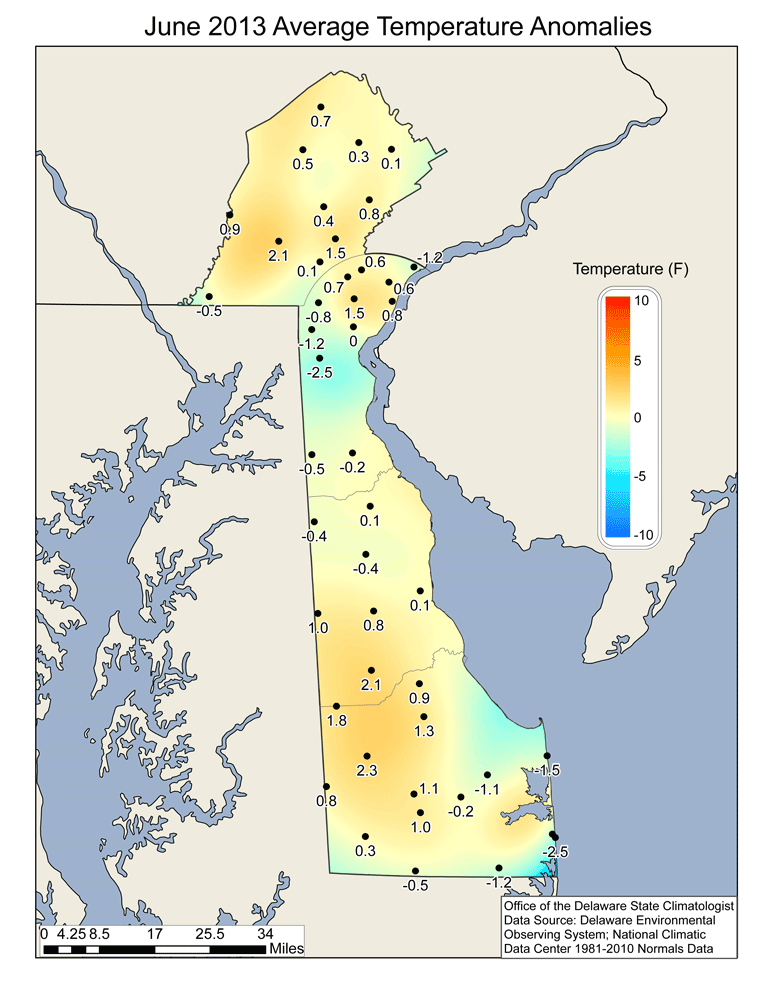
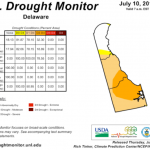
Data from the Delaware Environmental Observing System (DEOS) shows that the average June temperature anomalies across Delaware were generally positive and small during the month (Figure 3).

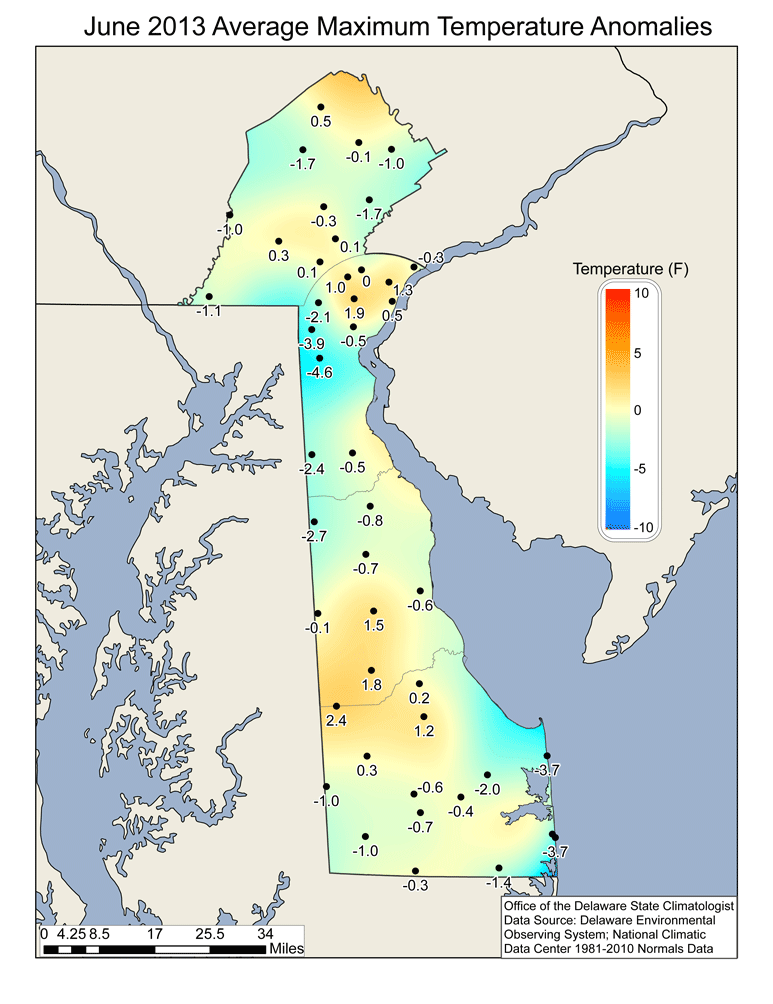
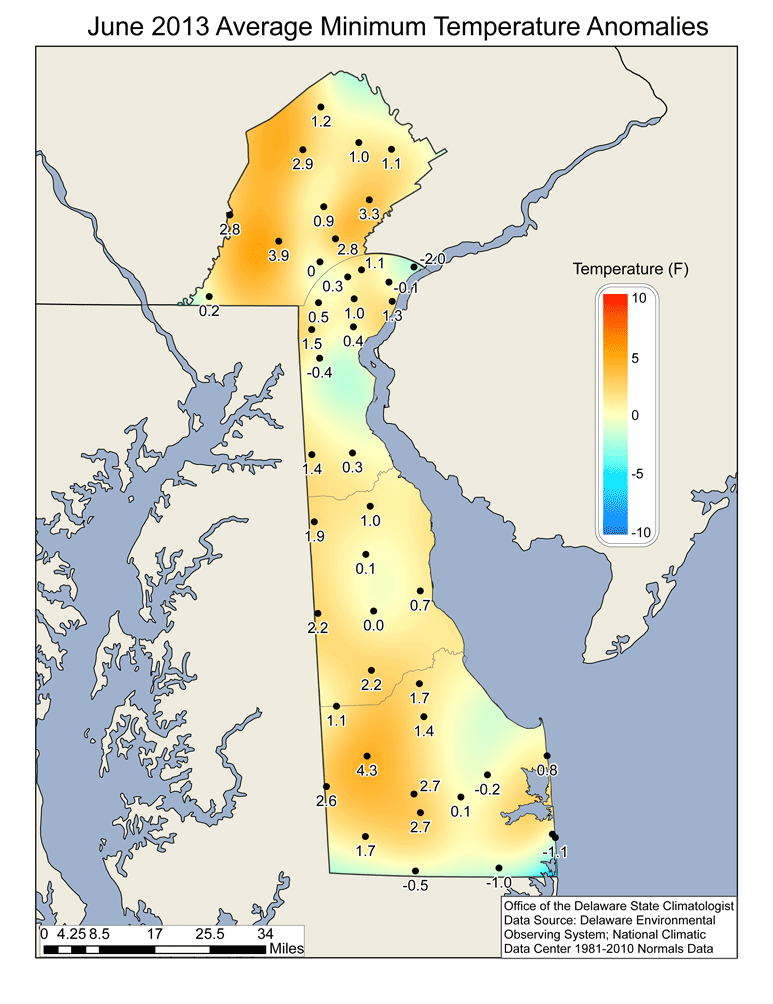
Average maximum temperatures were below normal for much of the State except for southern Kent and northern Sussex counties and in the Wilmington area. Average minimum temperatures across the State were significantly above normal in central and western Sussex County and across most of Chester County, PA (Figures 4 and 5).

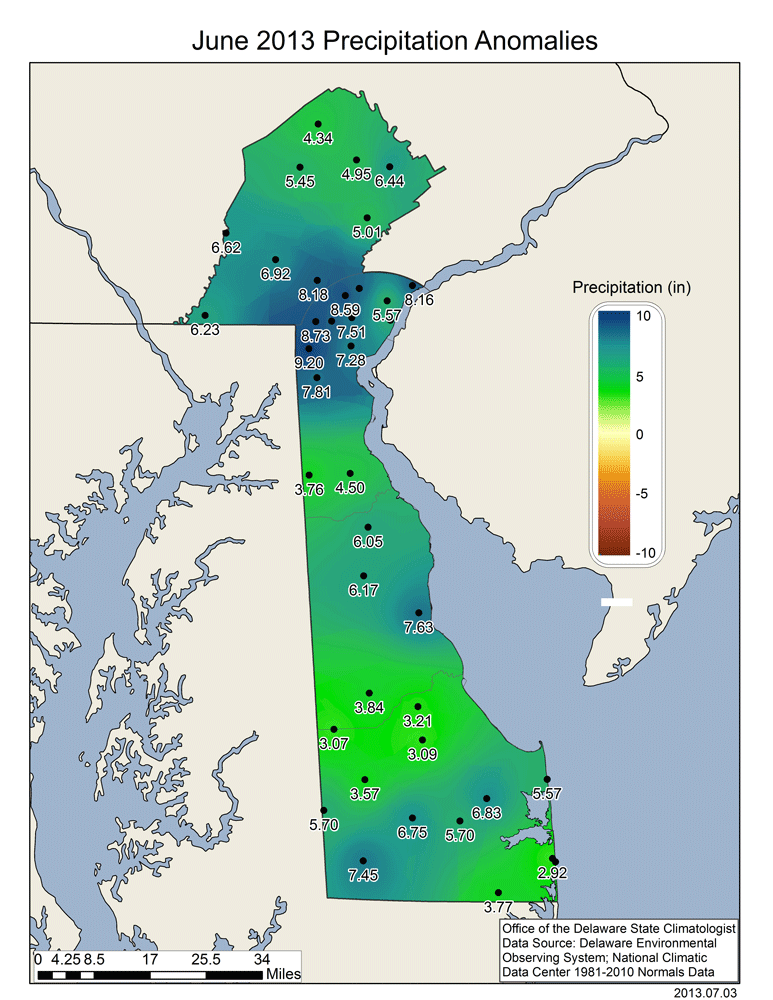
All stations in the DEOS network recorded much above normal rainfall values for June 2013. Areas with the greatest positive precipitation anomalies included south-central Sussex County and northern New Castle County. Many stations in northern New Castle County recorded rainfall anomalies of greater than 7” (Figure 6).

June 2013 average temperature departures from the 1981-2010 mean based upon DEOS station data

Figure 3. June 2013 average temperature departures from the 1981-2010 mean based upon DEOS station data.
Delaware June 2013 maximum temperature departures from the 1981-2010 mean based upon DEOS station data

Figure 4. June 2013 maximum temperature departures from the 1981-2010 mean based upon DEOS station data
Delaware June 2013 minimum temperature departures from the 1981-2010 mean based upon DEOS station data

Figure 5. June 2013 minimum temperature departures from the 1981-2010 mean based upon DEOS station data
Delaware June 2013 precipitation departures from the 1981-2010 mean based upon DEOS station data

Figure 6. June 2013 precipitation departures from the 1981-2010 mean based upon DEOS station data
 
Syndicate content
Sunrise in Delaware

2012 is Warmest Year on Record for Delaware Since 1895

Statewide Mean Annual Temperature 1895-2012

Figure 1. Delaware statewide mean annual temperature (°F) 1895-2012.

Preliminary data indicates that Delaware saw its warmest year on record during 2012.

The mean annual temperature of 58.8 ° F was 3.9 ° F above the 1895 – 2012 mean temperature, making it the warmest year since records began in 1895.

This year broke the previous record of 58.1 ° F set in 2011.

The six warmest years on record have all occurred since 1990 (Figure 1).

The warm temperatures were accompanied by very dry conditions across the state during the year. The statewide mean precipitation of 34.53” was 10.05” below the 1895-2012 statewide mean, making 2012 the 6th driest year since records began in 1895 (Figure 2).

Conditions in Delaware mirrored those across much of the United States.

The contiguous 48 states had their highest temperature and 15th driest year since 1895 (Figures 3 and 4).

 
Statewide Annual Precipitation 1895-2012

Figure 2. Delaware statewide mean precipitation (inches) 1895-2012.
US temperature anomalies for 2012

Figure 3. Temperature anomalies (°F) across the contiguous United States. Map provided by the National Climatic Data Center.
US temperature anomalies for 2012

Figure 4. Precipitation anomalies (inches) across the contiguous United States. Map provided by the National Climatic Data Center.
 
Syndicate content
Kites in the Sky

First six months of 2012 warmest and driest in Last 118 Years


The January through June 2012 mean temperature of 55.0 degrees Fahrenheit was greater than five degrees above the 1895-2011 average (Figure 1).


The statewide January through June precipitation total of 11.88 inches was nearly ten inches below the 1895-2011 average, making 2012 the driest January through June period since 1895 (Figure 2).

Although the final data may change the rankings slightly, it is clear that January


through June of 2012 was unusually warm and dry across the First State.


High evapotranspiration rates (evaporation from the surface and transpiration from vegetation) associated with the warm temperatures, combined with record low precipitation, have produced very dry conditions across much of the State (Figure 3). In fact, nearly 82% of the state is currently experiencing abnormally dry conditions, while nearly one-third is considered to be severely dry (much and Kent and Sussex Counties).


Images