Week of July 15th, 2026
Posted on July 16, 2026Note: The next drought report will be on August 19th, 2026.
Highlights:
- June 2026 was the 11th consecutive month with below normal, statewide precipitation.
- The precipitation deficit during this 11-month streak is -15.37 inches, and is the driest August-to-June in Delaware’s 131 years of climate observations.
- Streamflows at numerous stream gauges across the state are considerably below normal, with some locations experiencing their lowest levels ever for this time of year.
- Well levels continue to decline as result of the long-term, below normal precipitation conditions.
- Drought conditions are expected to persist through the remainder of summer into early fall.
Statewide Drought Discussion
Precipitation
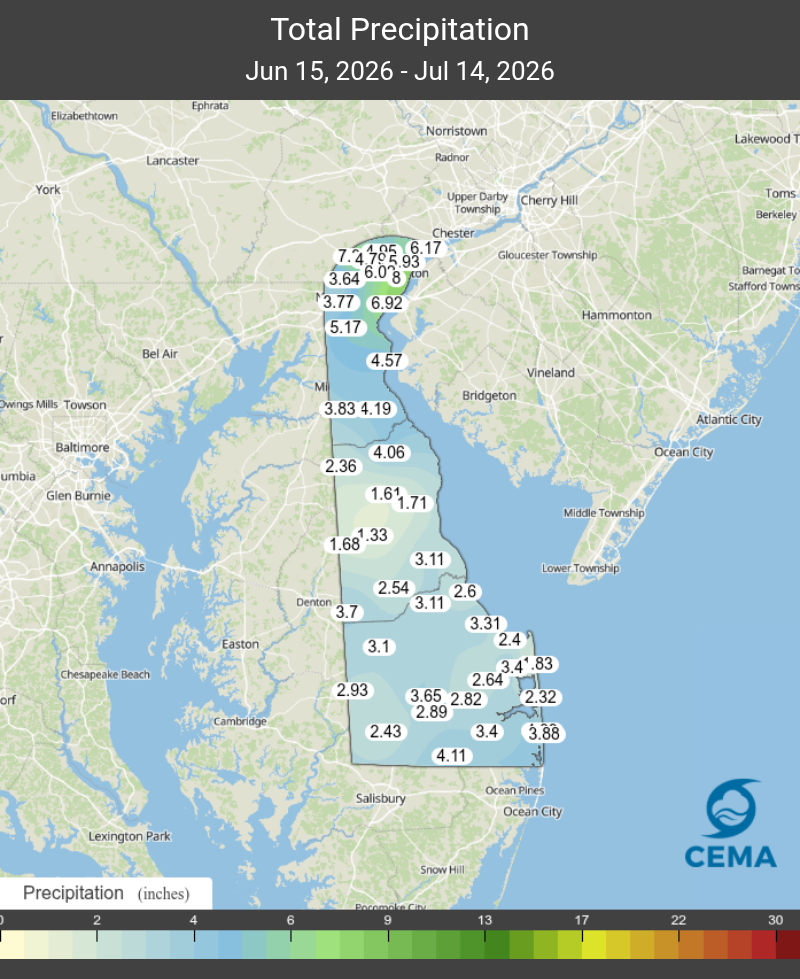
The story of precipitation really depends on your perspective. While some heavy rain events in New Castle County have eased drought concerns in that part of the state, Kent and Sussex Counties have largely missed out on the rain. Figure 1 shows precipitation totals for the last 30 days for stations in the DEOS Network. A general 6 to 8 inches of rain has fallen in the New Castle-Wilmington area. Meanwhile, only 1 to 1.5 inches has fallen in the Dover area. Most of the state has seen 2 to 3.5 inches, which is below normal for this time of year.
Another perspective to use for looking at precipitation is through the lens of time. In recent weeks, some areas of the state have seen above normal precipitation and other areas below normal precipitation, however statewide precipitation over the last 12 months has been below normal. Areas south of Dover, down to Georgetown, and over to Seaford are 16 to 20 inches below normal according to data from the Southern Regional Climate Center (Figure 2).
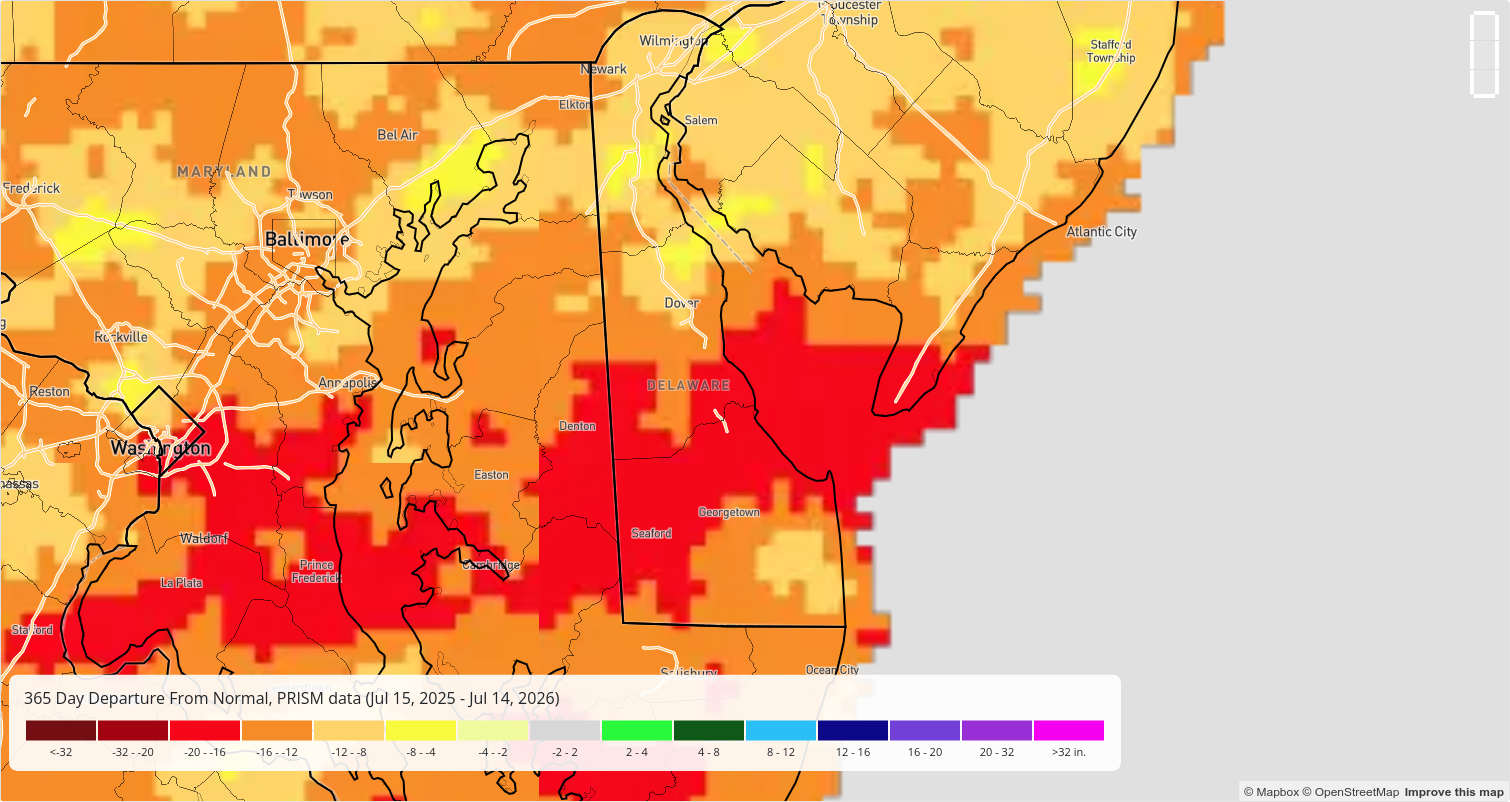
Even Port Penn, the area with the largest rainfall over the past 30 days, still sits 4 to 8 inches below normal for the last 12 months. As discussed later in this update, extended periods of below normal precipitation can have significant implications for groundwater. This also means that even if rainfall picks up in the short term, it will take much more to erase the current rainfall deficit.
Temperature/Evapotranspiration
Despite experiencing three consecutive days with 100+ °F temperatures earlier this month, the last 30 days have been in the normal range in terms of evapotranspiration (Figure 3). Higher humidity tends to lower evapotranspiration rates, and is likely offsetting the increased effect of the higher temperature over the last 30 days.
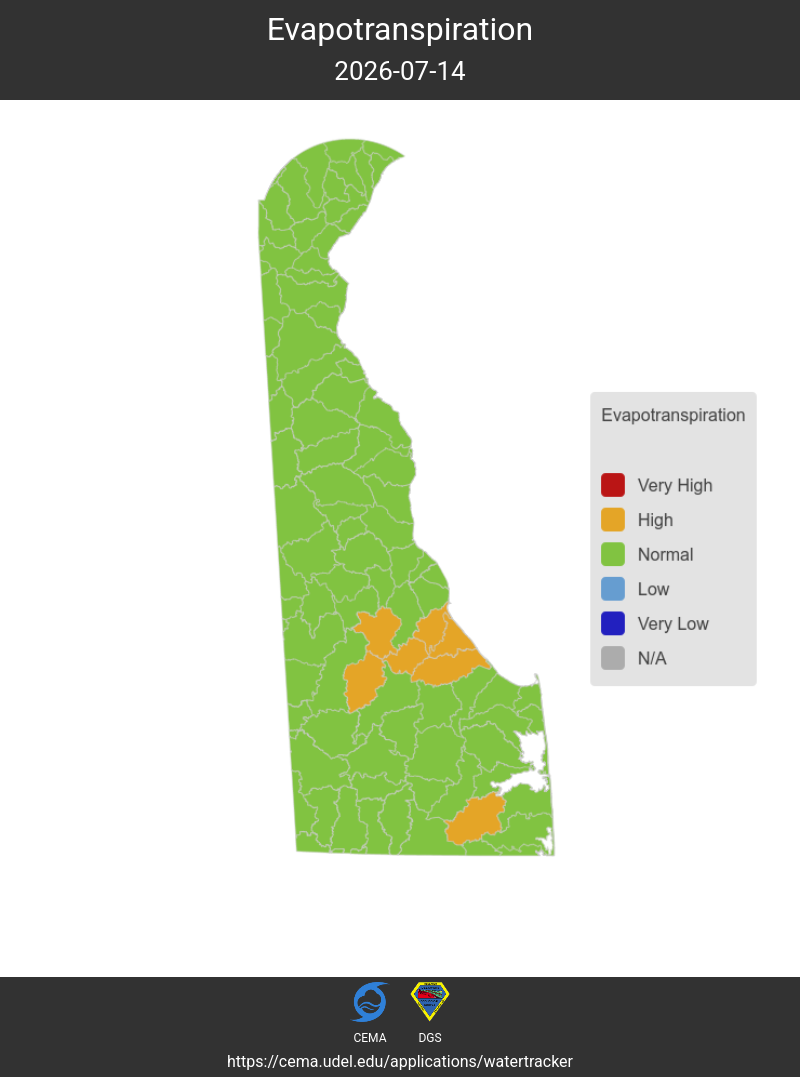
Figure 3 was created from the Delaware Water Tracker, which provides daily updates of groundwater levels, precipitation, and evapotranspiration for Delaware. Visit https://apps.cema.udel.edu/watertracker to learn more.
Soil Moisture
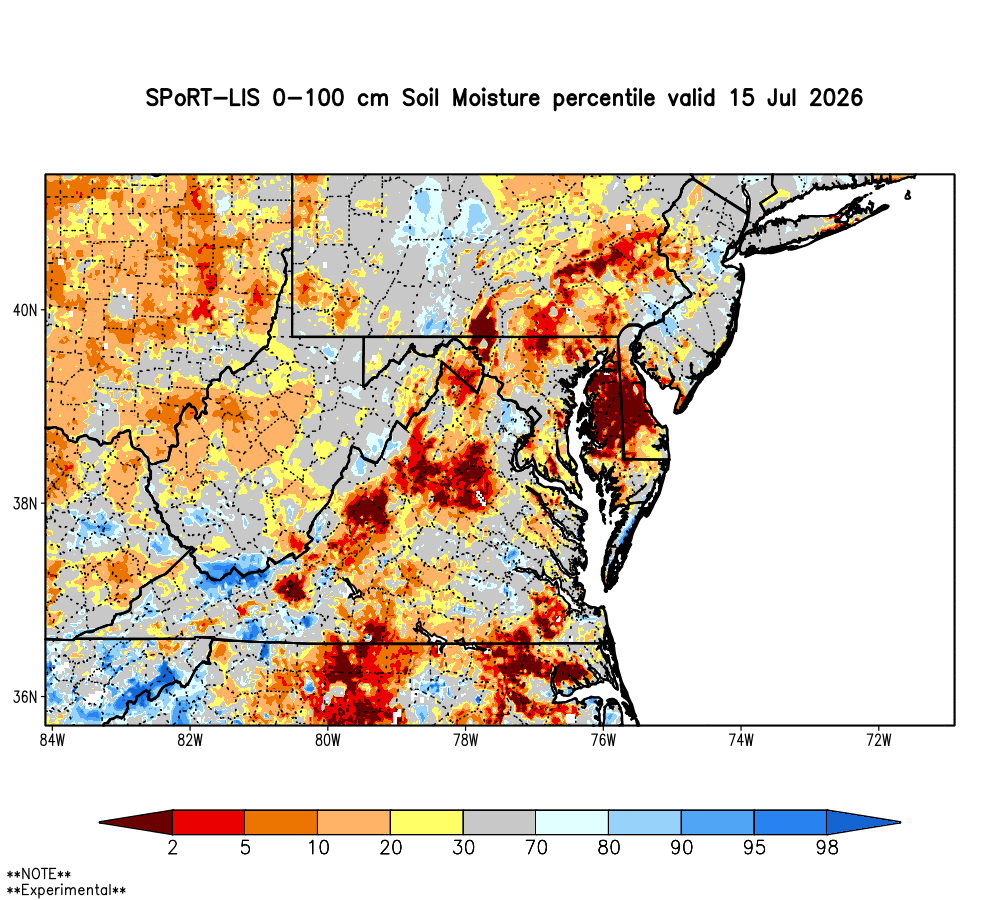
Seasonal precipitation, which is precipitation in the last 90 days, tends to heavily influence soil moisture in the upper meter of soil in Delaware (maybe the last 60 days in our sandier soils). And this month is no different. As Figure 4 shows, areas that have seen more rain recently, primarily located in New Castle County and portions of southeastern Sussex County, are in the normal to slightly below normal range for soil moisture percentiles. However, Kent County and northern and western Sussex County have abysmal soil moisture values with percentiles below the 2nd percentile.
Streamflow
The sustained decline in Delaware’s streams is a clear indication that we are headed into worsening hydrologic conditions heading into the hot months of summer. Added to the lack of precipitation is the fact that the streams did not fully recover from the low flows that occurred in the fall of 2025. When streamflow drops steadily over three months in the spring, the resulting shallow depths can lead to elevated water temperatures, which could impact the local fish habitat.
In northern New Castle County the flows on White Clay Creek, Red Clay Creek, and Brandywine Creek at Wilmington continued to decline, dropping into the below normal to much below normal ranges. This means that for this specific time of year, the flows are encountered less than 10% of the time since streamflow records have been recorded.
In Kent County, the St. Jones River at Dover has maintained flow in the below normal range with a few excursions into the normal range. However, flows on the Nanticoke River at Bridgeville dropped to extremely below normal during early spring and have continued to decline. These flows could potentially be setting new records for low flows on the Nanticoke.
These sustained low-flow conditions pose significant risks to aquifer recharge and water quality parameters. To transition these systems back to seasonal norms, the state needs a sustained period of significant, above-normal precipitation over at least the next 60 days to offset current deficits.
Chlorides
One of the most definitive indicators of a regional drought is the behavior of the Delaware River salt front—the interface where salty ocean water meets fresh river water. Although specific conductance (a proxy for chloride) readings at the Christina River at Newport have been relatively low since March, concentrations have started to increase as the salt front advances up the Delaware River. Freshwater inflow to the Christina from scattered summer storms will have a tendency to impede the advancement of chlorides, which is indicated by a July 14th reading of 48.6 ppm – well below the 250 ppm threshold.
This should not be taken as a sign that hydrologic conditions aren’t serious. Even though the flows on the tributaries are very low, the water at the gage at Newport is being kept fresh by a continuous flow of freshwater coming down the mainstem Delaware River.
Groundwater
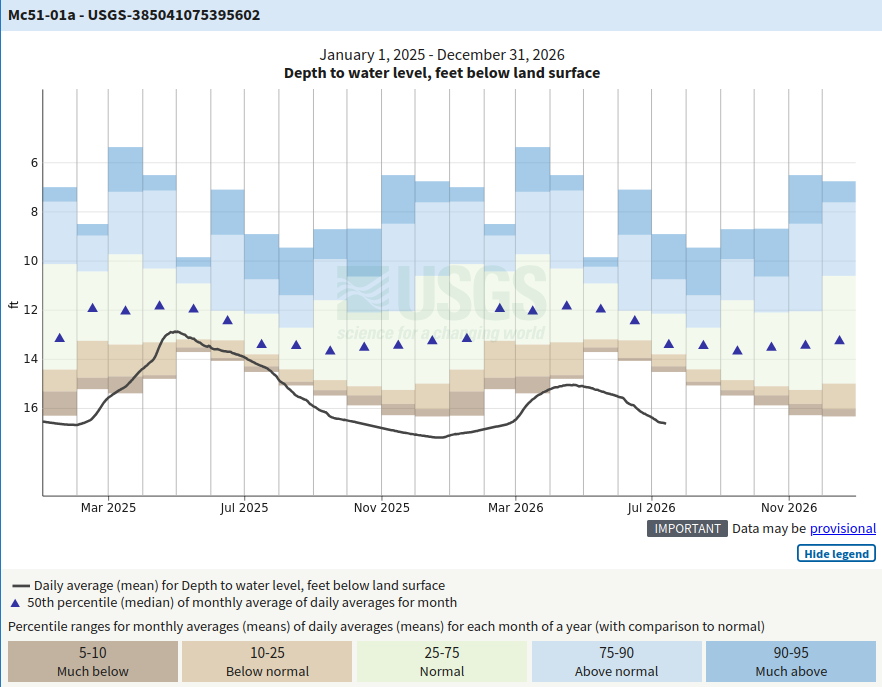
Near Newark, the depth to the unconfined aquifer as measured in well Db24-18, dropped to over 14.7 feet below the land surface (fbls), which exceeds the typical July average of 10.1 to 12.9 fbls. Unfortunately, a substantial amount of precipitation will be necessary for the water level in this well to recharge 1.8 ft, which will bring this water level to the very low end of normal for this time of year. A critical USGS/DGS monitoring well in southwestern Kent County (Mc51-01a) has consistently been tracking below the 5th percentile, which has the potential to be a record low for this well. In July, the normal water level in this well is between 11.6 and 13.5 fbls; however, the current water level is at 16.6 fbls, which is extremely below normal (Figure 5).
After remaining in the normal range, monitoring well Pf24-02, located south of Georgetown, dropped into the below normal range in late June. This very recent drop in the water level reflects the geographic variability in groundwater response across Delaware.
Delaware’s groundwater system responds slowly to changes in precipitation compared with surface waters (like streams and rivers). As a result, patterns of dry weather tend to show up first in streamflow and soil moisture, and then, if dry conditions persist, in groundwater levels and aquifer conditions.
Groundwater is a major source of drinking water and irrigation supply in much of Delaware, especially south of the Chesapeake and Delaware Canal. Extended periods of low levels can reduce well yields and may require deeper pumping or alternative supply strategies in some communities. Persistently low groundwater levels increase the risk of saltwater intrusion in coastal and near-estuarine aquifers, complicating long-term freshwater sustainment. In addition, low groundwater can stress wetlands and baseflow conditions to streams during dry periods, affecting fish, invertebrates, and riparian habitats.
Weather and Climate Outlook
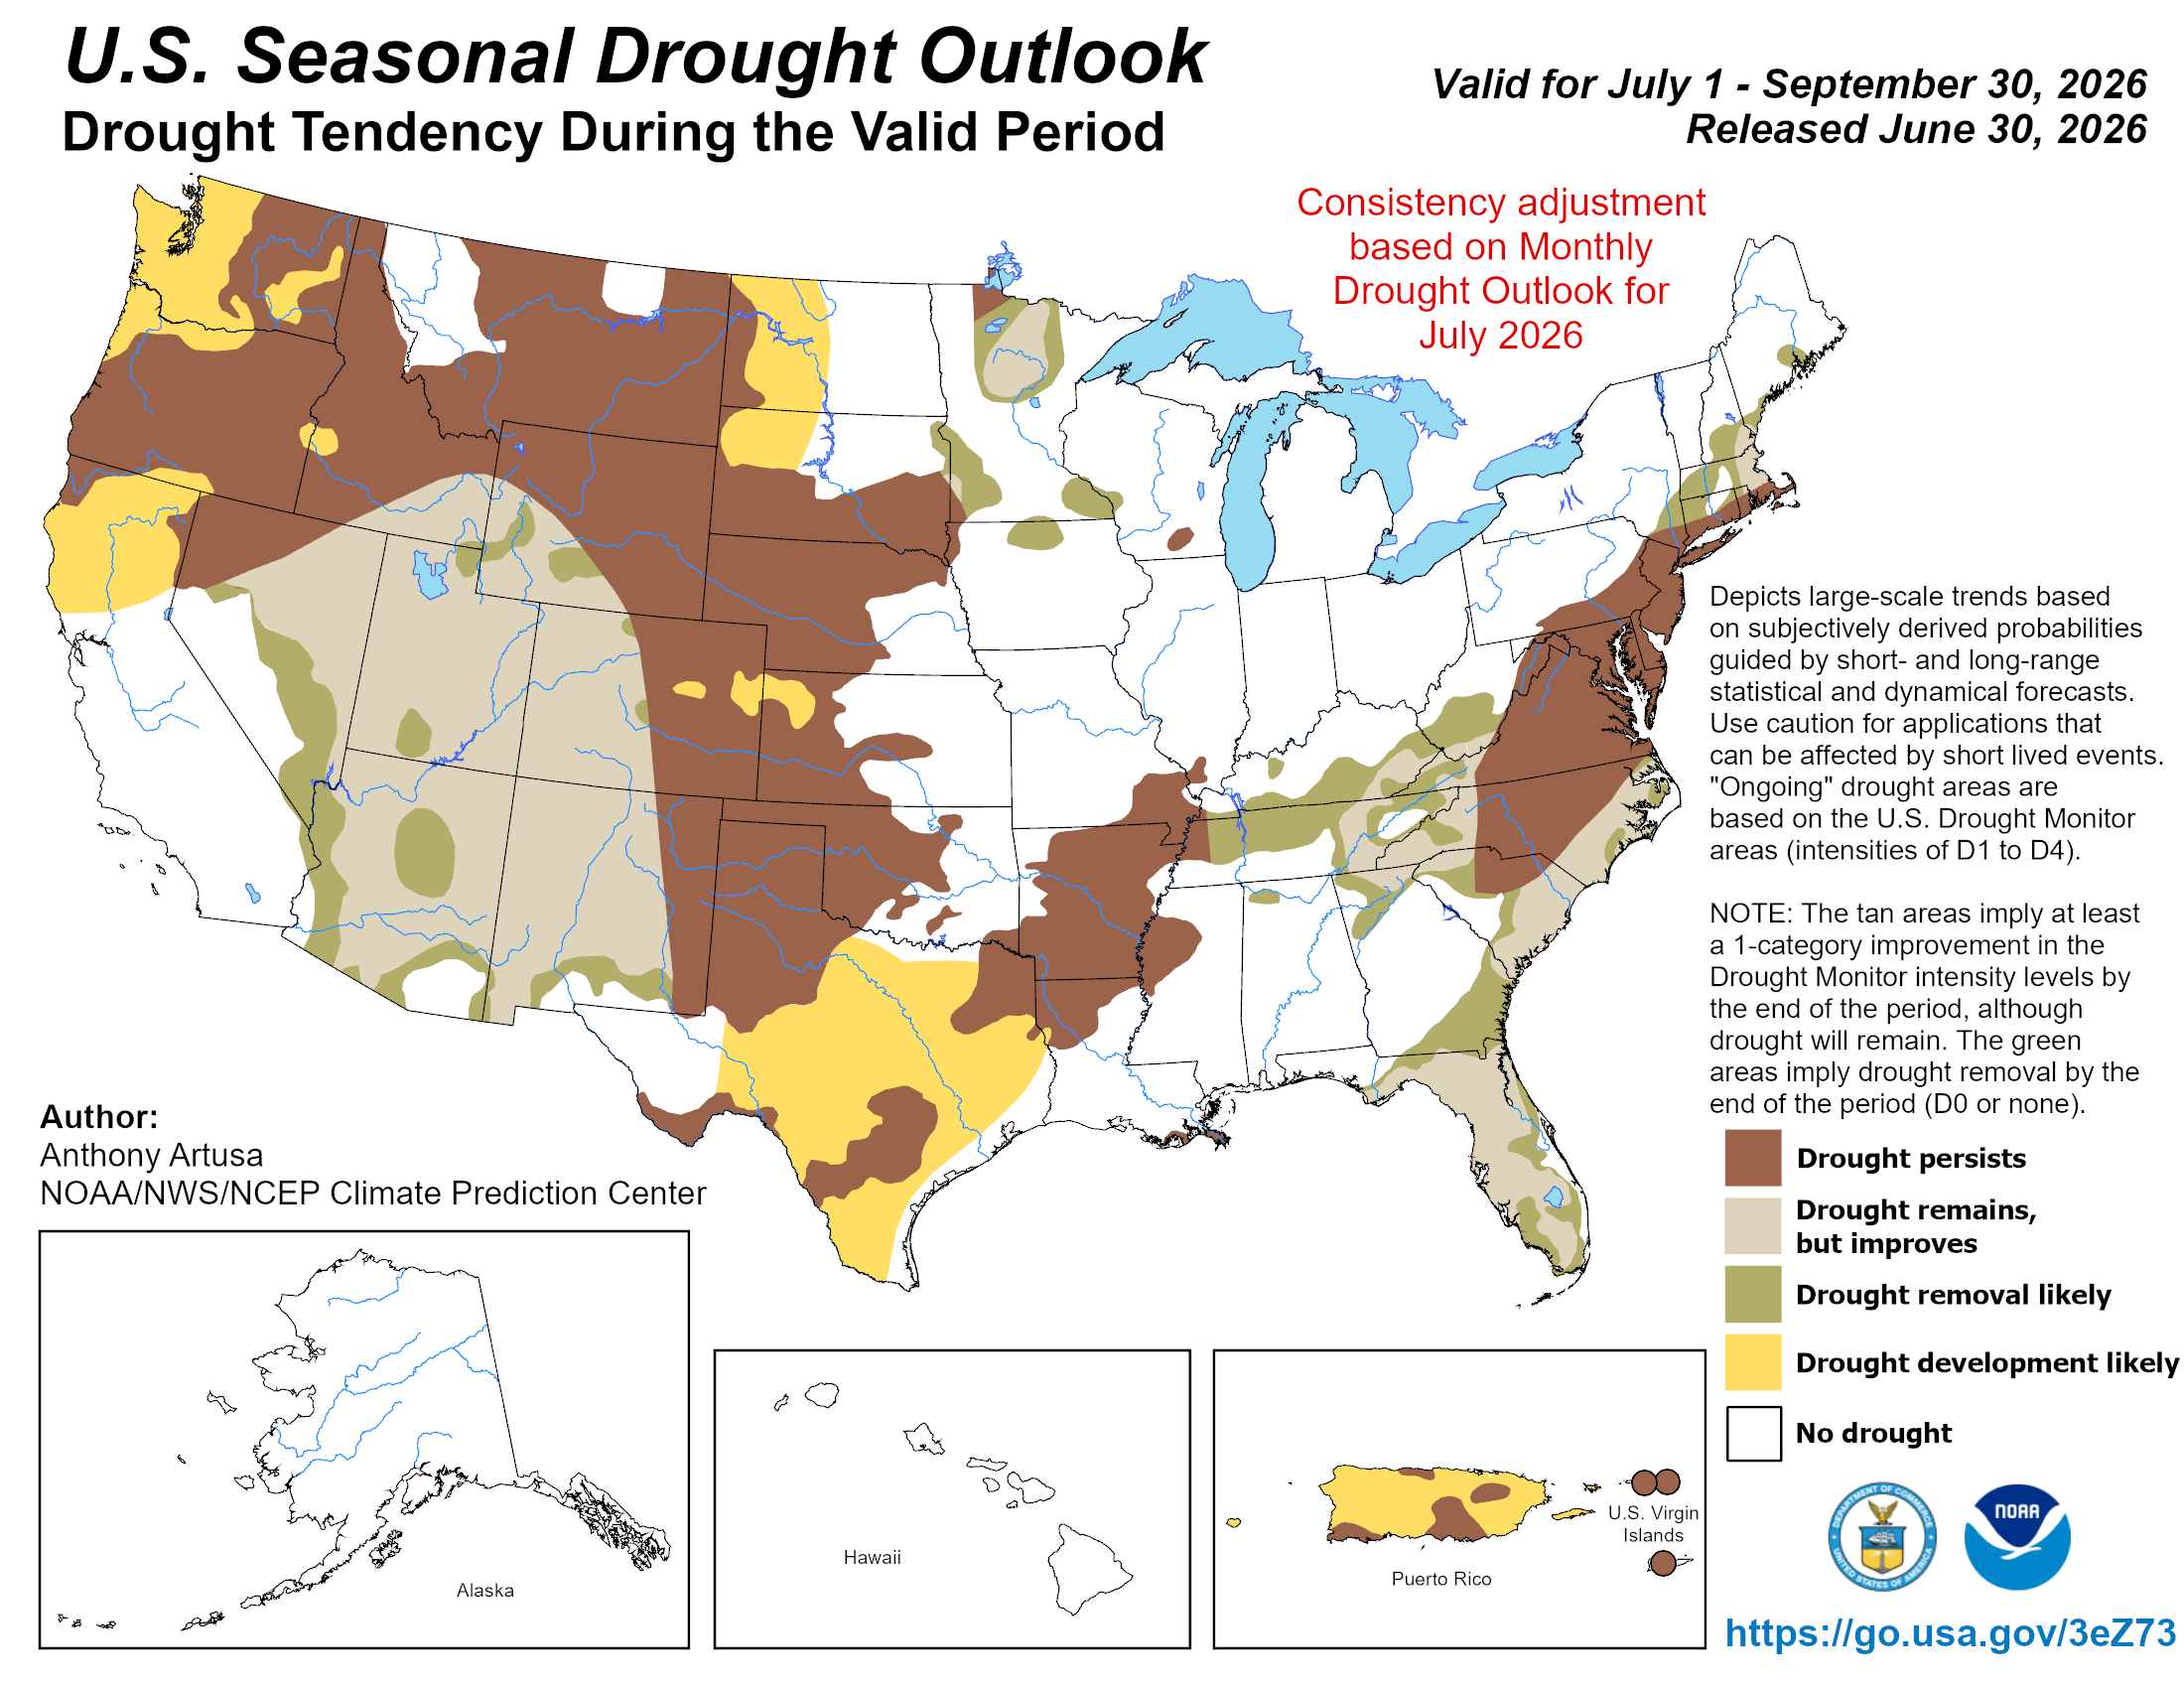
When Delaware experiences a summer drought, it’s very difficult to significantly improve those conditions because of its climate. Our state tends to operate in a “deficit” during the summer as water from the surface evaporates at a much higher rate than the amount of precipitation we receive. That doesn’t mean it can’t happen, but it’s unlikely. In fact, we’ve only experienced two statewide, summer water balance surpluses in the last 10 years. Those are not great odds. Figure 6 shows the Climate Prediction Center’s seasonal drought outlook for July through September.

Note that Delaware and most of the surrounding area are not expected to recover from the current drought. Part of that is our climate and part of that is the seasonal forecast, which isn’t expected to be especially wet. While some improvement is possible, completely getting rid of the current drought we’re in by the end of September is unlikely.


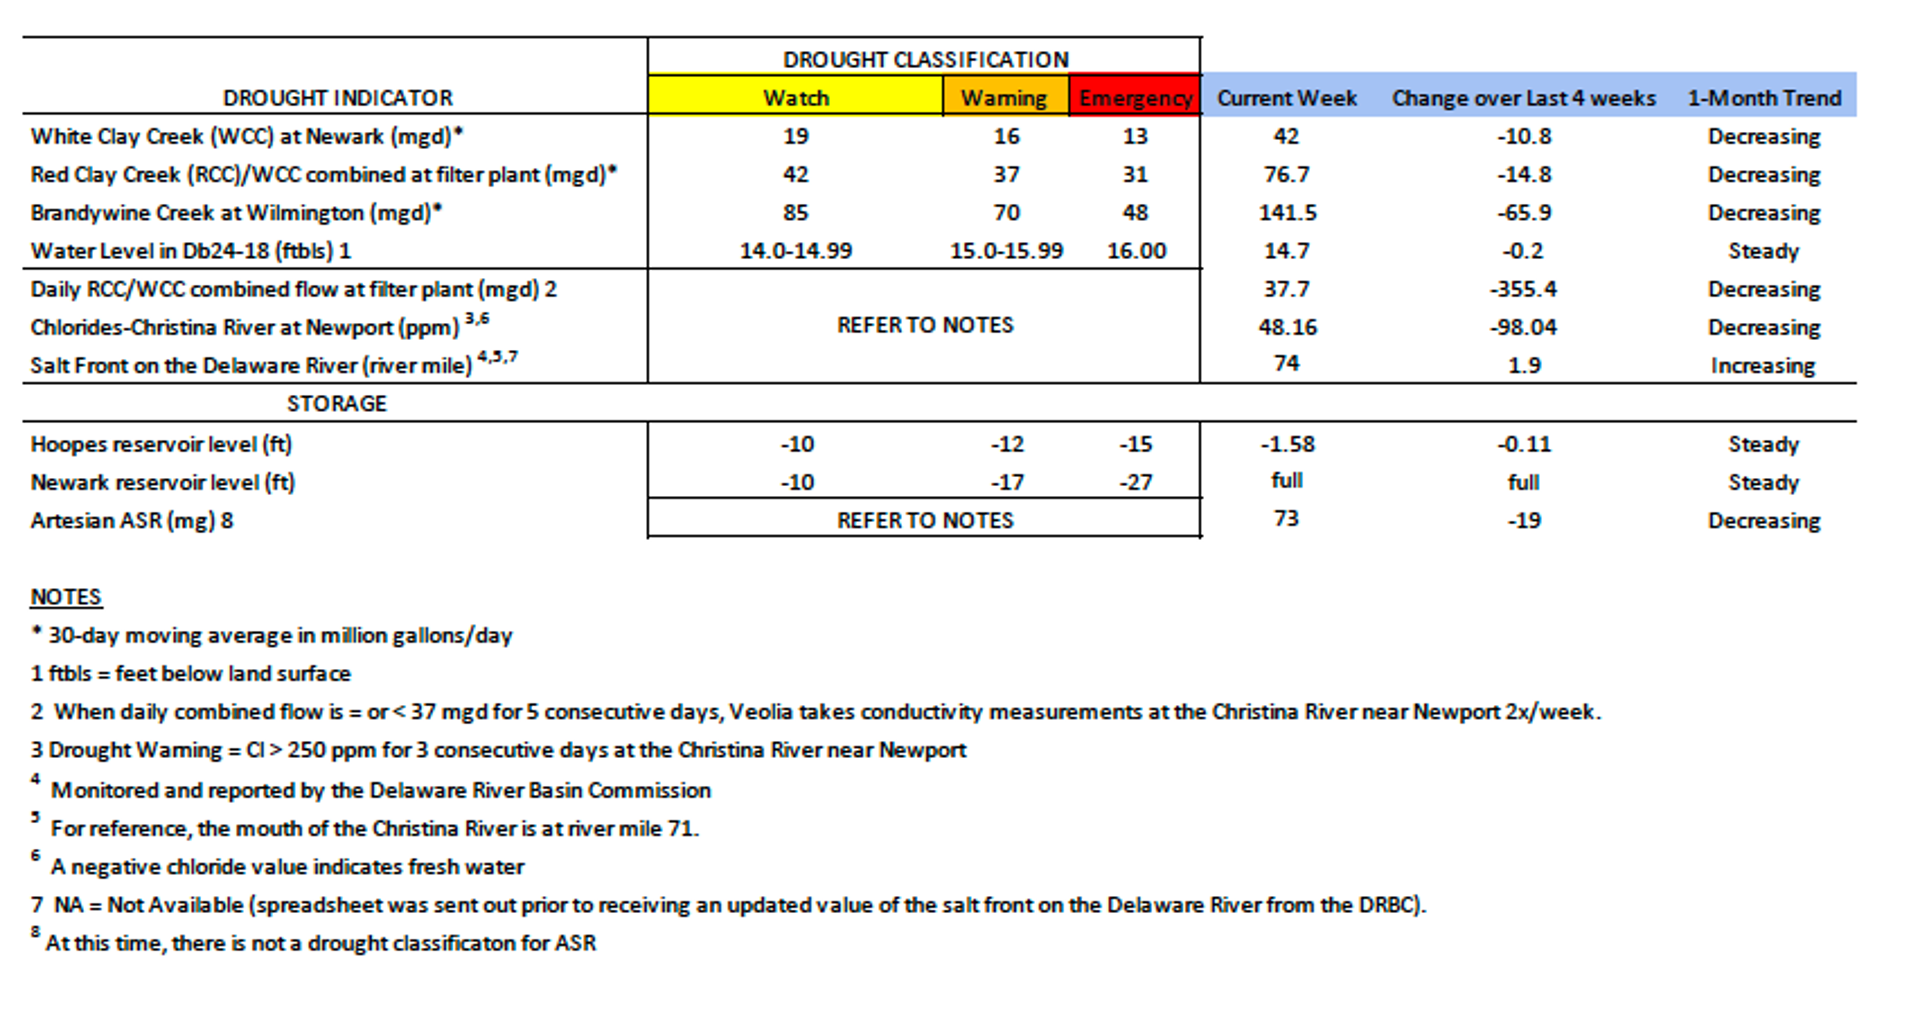
Delaware Drought Status
Watch
Resources
- Delaware Water Tracker
- DGS Water Conditions Report
- US Drought Monitor
- NOAA Climate at a Glance
- Drought.gov DE site
- DE Water Supply Coordinating Council
- DRBC Drought Dashboard
- Surrounding State Pages:
Climate Office Partners


