March Temperatures
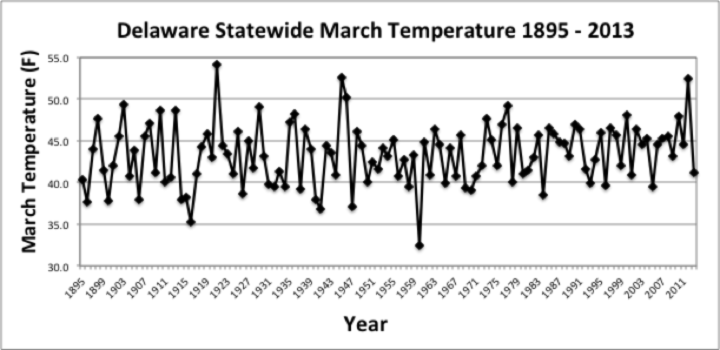
Preliminary data indicates that the statewide average temperature in March was 41.2° F. This is 2.9° F below the 1981-2010 normal of 44.1° F (Figure 1).
March, the first month of climatological spring, was more than 4°F colder than December 2012, the first month of winter.
The difference in temperature between March 2012 and this year was apparent to most Delawareans, with March 2013 temperatures 11.3° F colder than last March.
March Precipitation
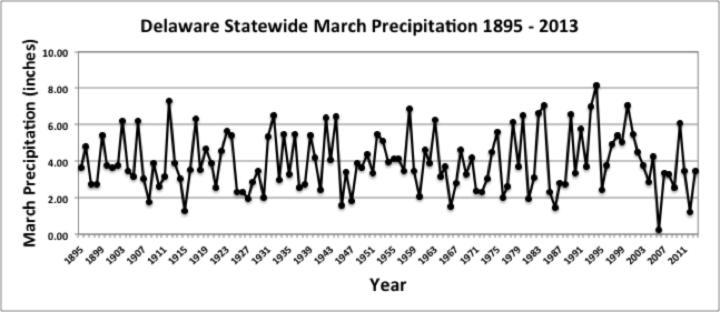
Delaware’s statewide precipitation for March 2013 averaged 3.44”, which is 0.82” below the 1981-2010 mean (Figure 2). Even with this below normal rainfall amount, Delaware did have 2” more precipitation in March 2013 compared to March 2012.
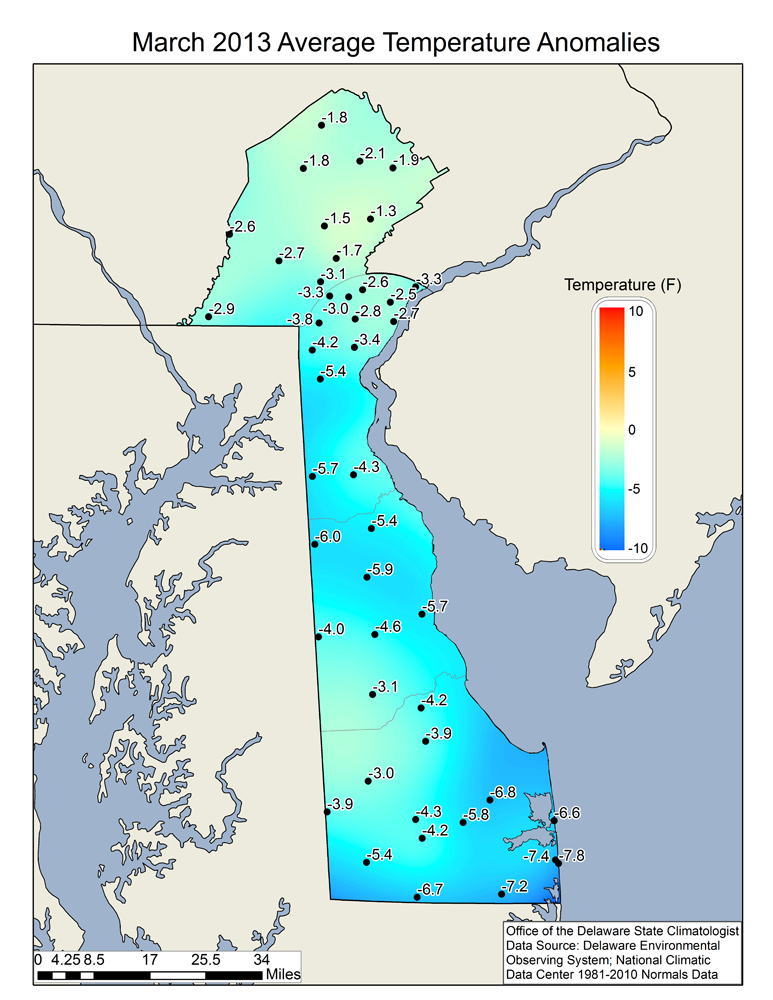
Statewide Spatial Averages
Spatially, data from the Delaware Environmental Observing System (DEOS) shows that the average March temperatures across Delaware were significantly below normal across southern and coastal Sussex County and across central portions of Kent County. Northern portions of Delaware and Chester County, PA had more modest negative temperature departures (Figure 3).
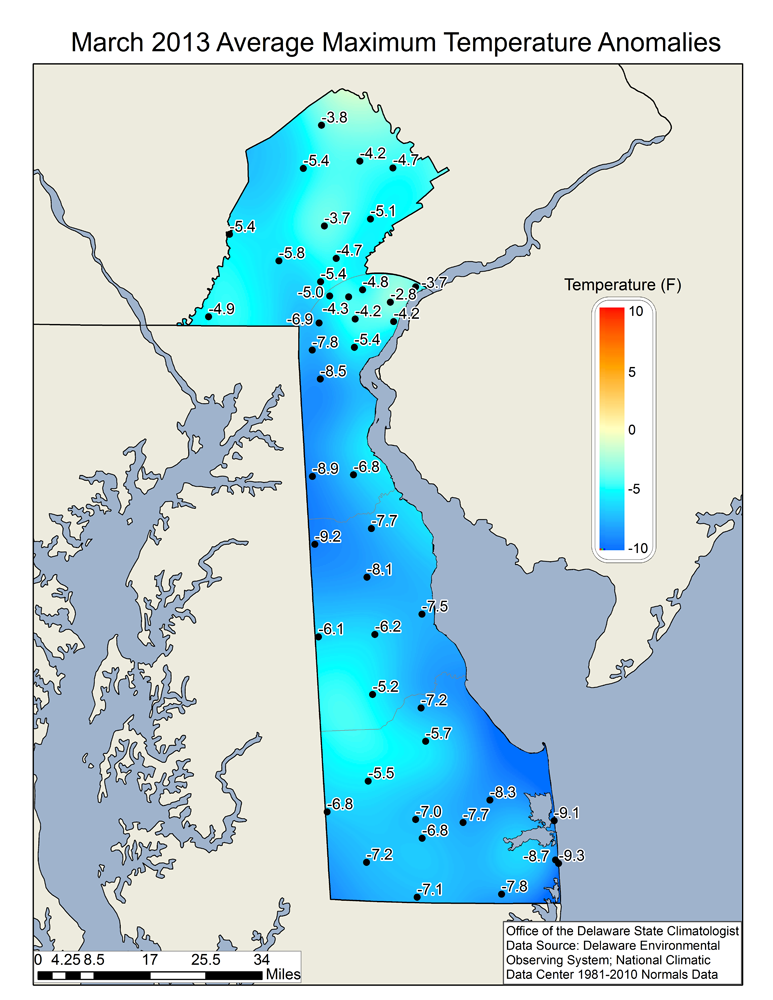
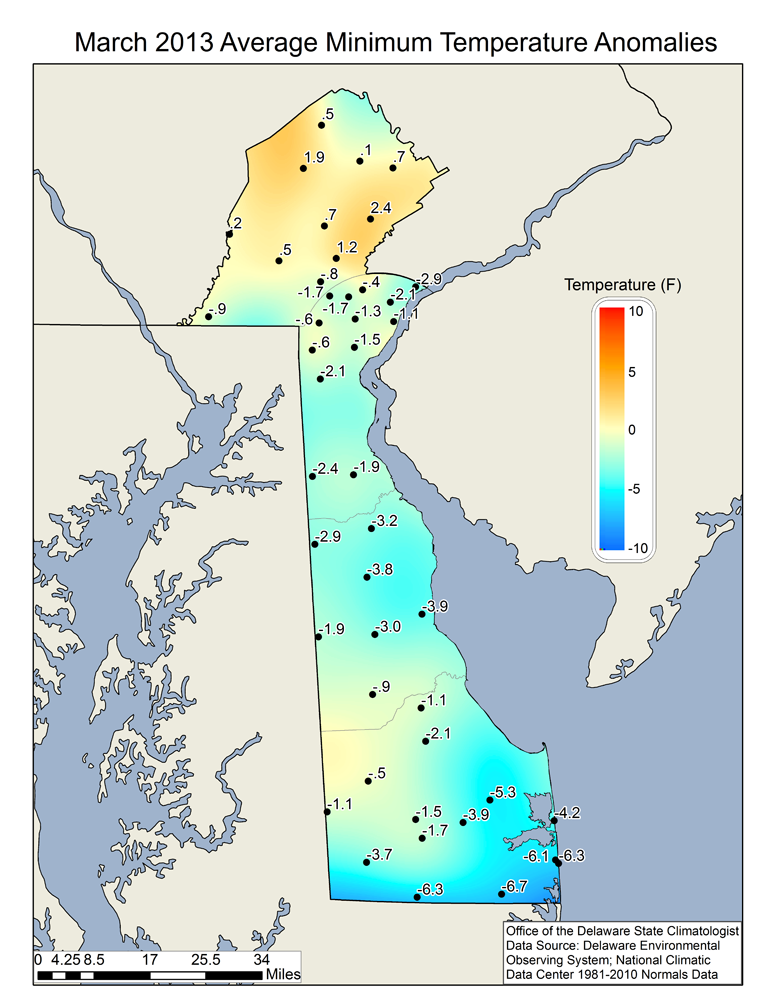
Mean maximum temperatures were far below normal across the entire state (Figure 4), while mean minimum temperatures were significantly below normal across southern Sussex County and near normal in northern New Castle County (Figure 5).
Mean minimum temperatures were actually slightly above normal across portions of Chester County, PA.
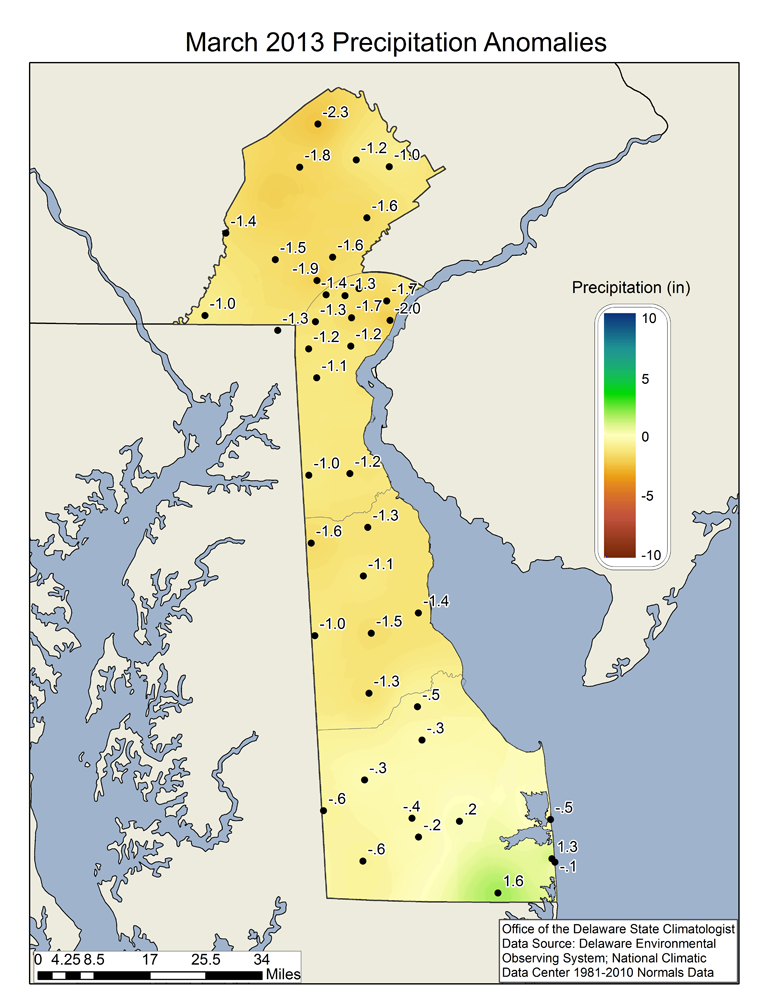
Precipitation deficits compared to the 30-year normals were greatest in northern Delaware and Chester County, PA, decreasing to near normal values across much of Sussex County (Figure 6).
Similar Posts
- March 2026 – Very Warm with Below Normal Precipitation Across Delaware (2026)
- March 2025 – Very Warm with Above Normal Precipitation Across Delaware (2025)
- March 2024 – Very Warm and Wet Across Delaware (2024)
- March 2023 – Warm with Much Below Normal Precipitation Across Delaware (2023)
- March 2022 – Warm and Dry Conditions Continue Across Delaware (2022)
Climate Office Partners


