While precipitation and temperatures varied across the state, Delaware’s climate during October 2013 was generally characterized by warmer than normal temperatures and near normal precipitation values.
Delaware’s Climate during October 2013 was characterized by warmer than normal temperatures and near normal precipitation values.
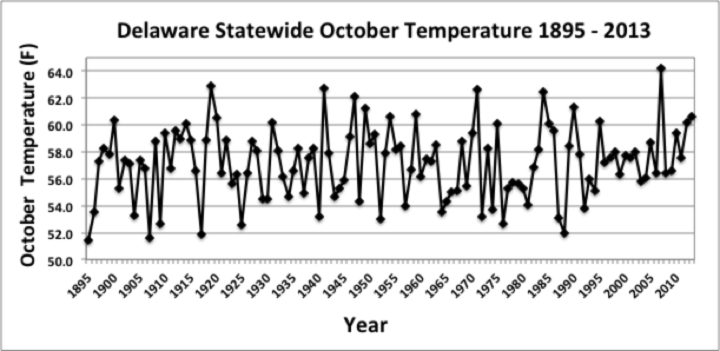
October Temperatures
Preliminary data indicates that the statewide average temperature in October was 60.6°F. This was 3.1°F above the 1981-2010 normal of 57.5°F (Figure 1) and marks the first month since July with above normal temperatures.
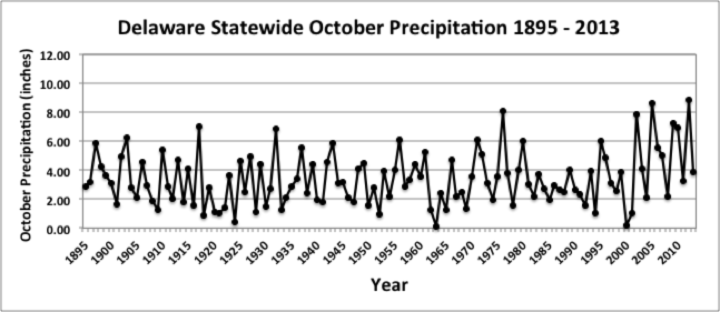
October Precipitation
Delaware’s statewide precipitation for October 2013 averaged 3.87 inches, 0.25 inches above the 1981-2010 mean of 3.62 inches (Figure 2). Although only slightly above normal, this month’s precipitation was more than 3.0 inches greater than what fell in September.
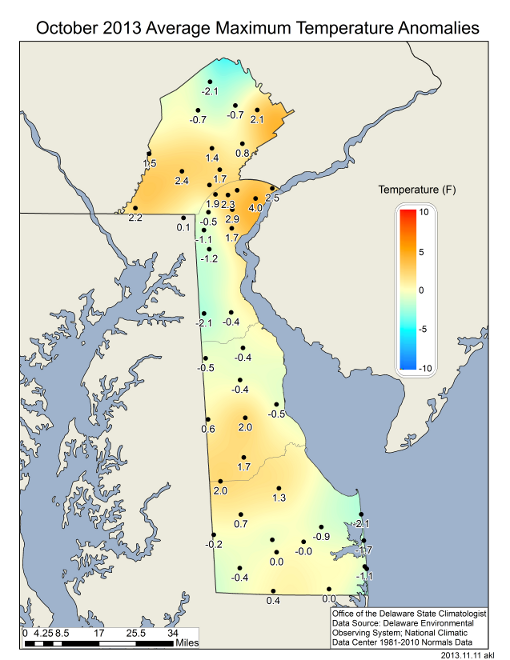
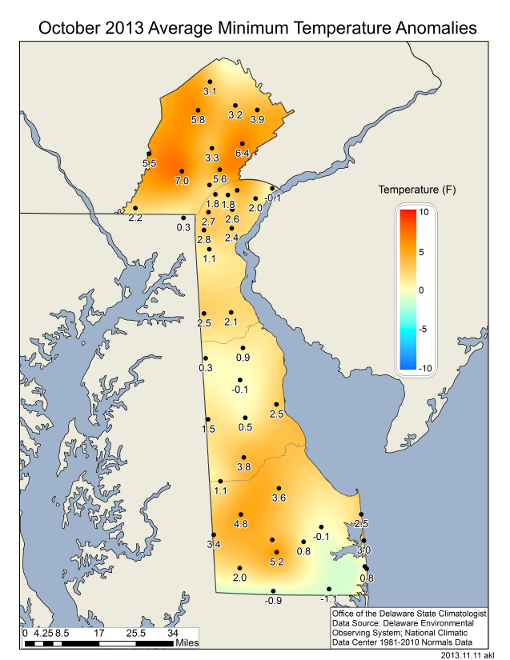
Statewide Spatial Averages
October average monthly temperatures were generally above normal across the DEOS (deos.udel.edu) network, except for stations along the Atlantic Coast and in extreme southern Sussex County (Figure 3). Average maximum temperatures varied across the state with below normal values found along the coast and in western New Castle and northern Kent Counties (Figure 4), while average minimum temperatures were more than 4°F above normal in several locations across the State (Figure 5).
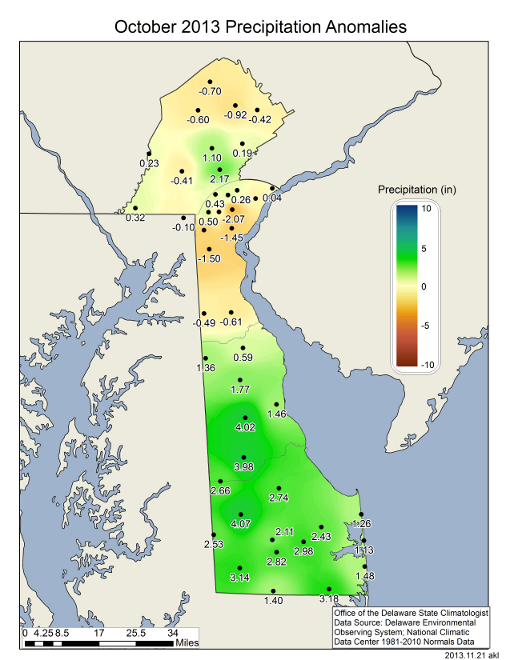
Precipitation was significantly below normal across most of New Castle County and Chester County, PA, while both Kent and Sussex Counties saw above normal precipitation for the month (Figure 6). Much of the precipitation in the southern portion of the state fell during the period from the 9th to 12th of October in association with a persistent coastal storm that brought heavy precipitation to this portion of the State.

Similar Posts
- October 2025 – Near Normal Temperatures with Below Normal Precipitation Across Delaware (2025)
- October 2024 – Record Dry Conditions with Near Normal Temperatures (2024)
- October 2023 – Warm and Dry Across Delaware (2023)
- October 2022 – Below Normal Temperatures and Near Normal Precipitation Across Delaware (2022)
- October 2021 – Very Warm with Near Normal Precipitation Across Delaware (2021)
Climate Office Partners


