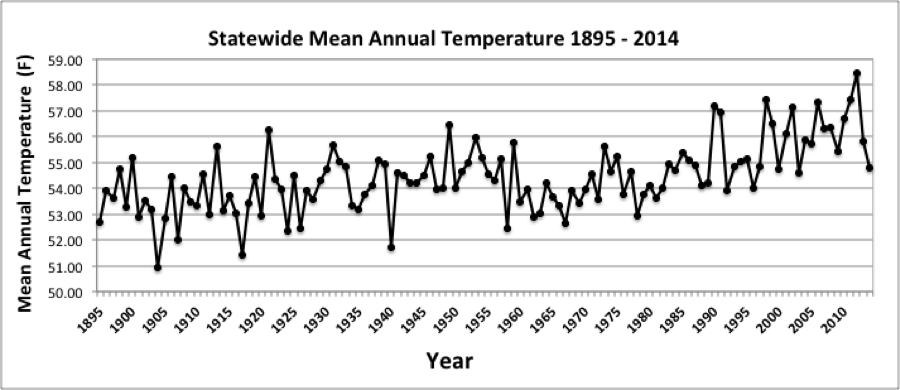
Annual Temperatures
Statewide mean annual temperature in 2014 was 54.8°F according to preliminary data from the National Climatic Data Center (NCDC). This was 0.6°F below the 1981-2010 normal of 55.4°F (Figure 1) and was the coolest year in Delaware since 2003.
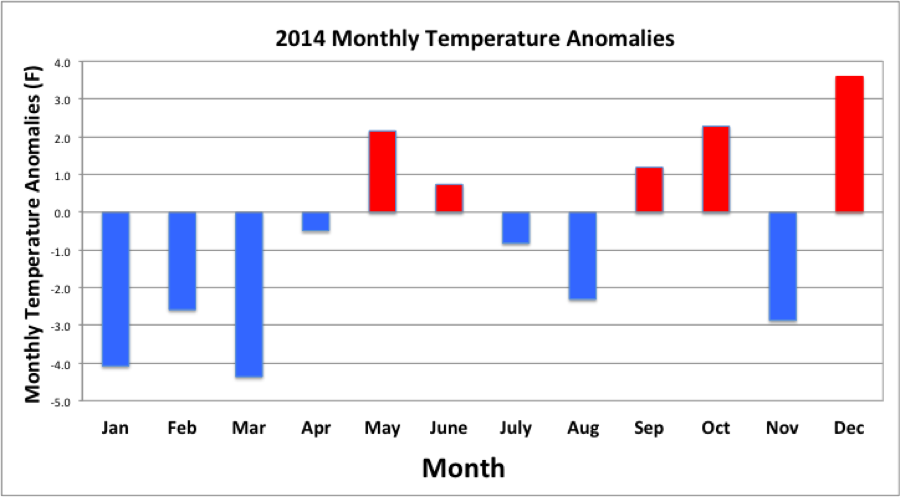
Monthly temperatures varied greatly throughout the year (Figure 2). The first four months of 2014 saw much below normal temperatures accompanied by heavy snowfall across the State. Although late spring and early summer saw a return to above normal temperatures, the late summer climate was cooler than normal, a welcome respite from the summer heat for many residents. The year ended with a return to warmth in three of the last four months.
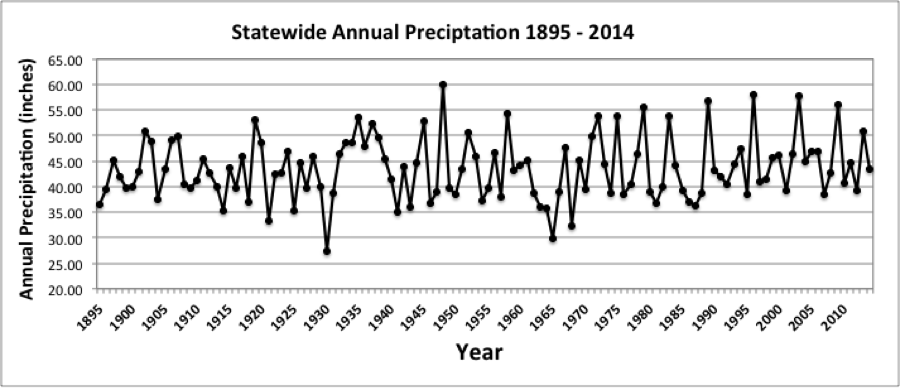
Annual Precipitation
Statewide precipitation in 2014 averaged 43.49 inches, 0.84 inches below the 1981-2010 mean of 44.33 inches (Figure 3).
Monthly precipitation anomalies varied between positive and negative throughout the year, with six months of above normal and six months of below normal precipitation (Figure 4). None of the monthly precipitation anomalies were large, leading to the near normal annual total.
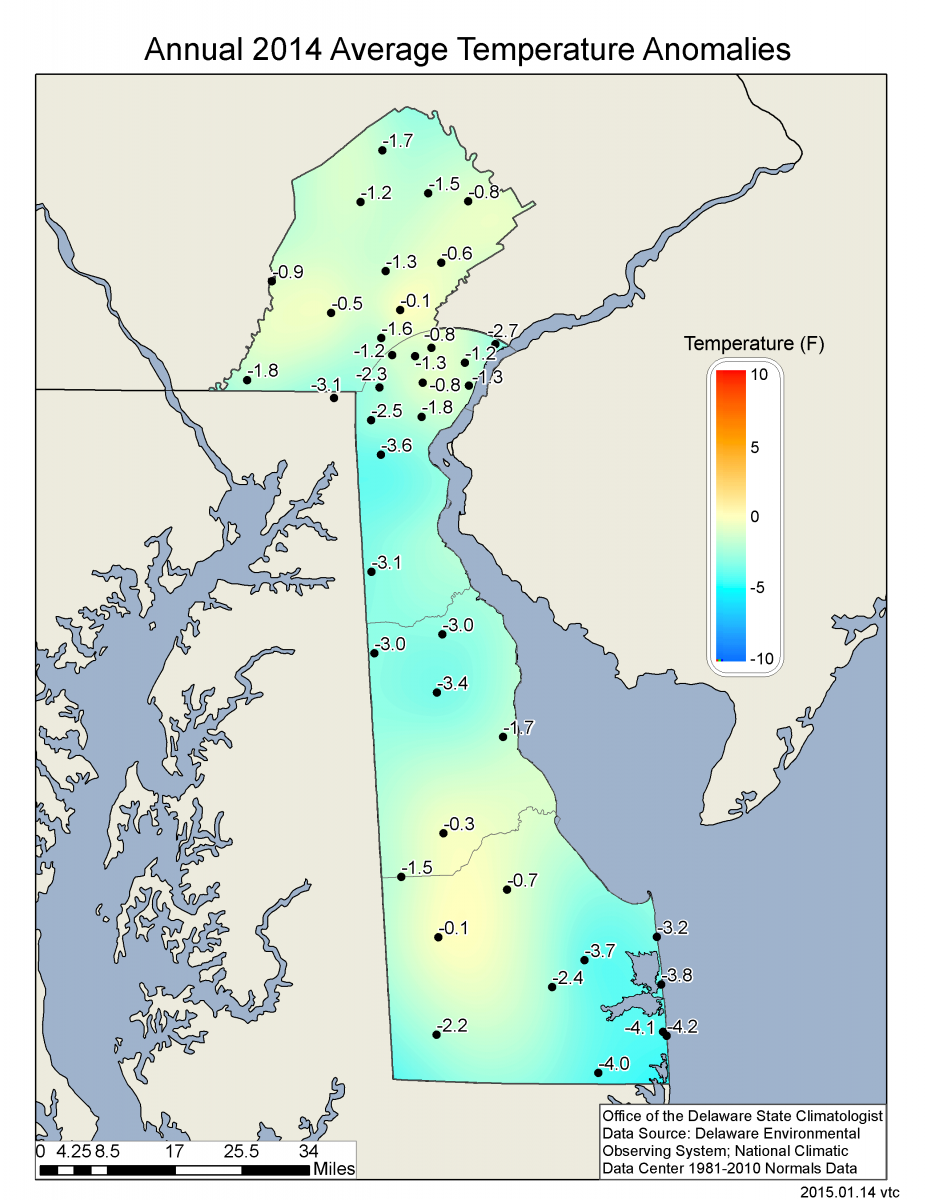
Statewide Spatial Averages
According to data from the Delaware Environmental Observing System (DEOS; deos.udel.edu), mean annual temperatures were below normal across the entire State with the largest negative anomalies found in coastal Sussex County (Figure 5).
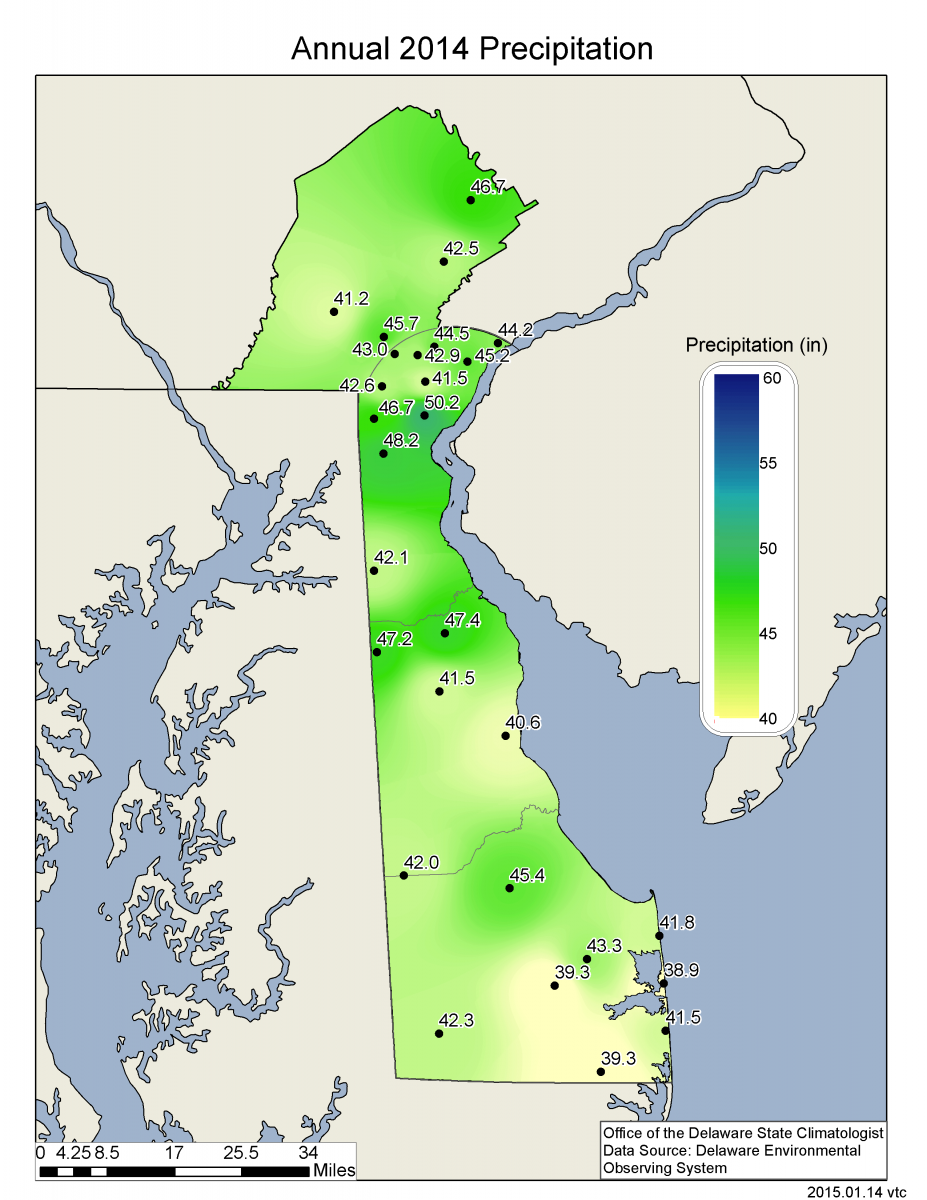
Precipitation across the region varied substantially in 2014, ranging from just under 39 inches to greater than 50 inches across the region (Figure 6).

Similar Posts
- May 2026 – Continued Dry Across Delaware (2026)
- April 2026 – Very Warm and Dry Across Delaware (2026)
- March 2026 – Very Warm with Below Normal Precipitation Across Delaware (2026)
- February 2026 – Cold with Near Normal Precipitation Across Delaware (2026)
- January 2026 – Cold with Near Normal Precipitation Across Delaware (2026)
Climate Office Partners


