November Temperatures
Preliminary data indicates that the statewide average temperature in November was 43.6°F, which is 4.0°F below the 1981-2010 mean value of 47.6°F (Figure 1). This places November 2019 as the 22nd coldest since records began in 1895.
November Precipitation
Delaware’s statewide precipitation for November 2019 averaged only 1.46 inches, 1.94 inches below the 1981-2010 mean (Figure 2). This placed the November 2019 precipitation amount in the bottom one-third of months since 1895.
Statewide Spatial Anomalies
Data from the Delaware Environmental Observing System (DEOS) show that temperature departures were uniformly below normal throughout the State (Figure 3), with the largest negative anomalies reaching values greater than -6°F. Precipitation was below normal at all stations across the State (Figure 4), with several stations in Kent County recording anomalies of greater than 2” below the long-term mean value.
National Anomalies
Temperatures were below normal throughout the eastern portion of the U.S, where some negative anomalies reached greater than 7°F (Figure 5). The western one-third of the U.S. saw above normal temperatures for the month, with parts of the Pacific Coast recording temperatures more than 5°F above normal. Precipitation varied greatly across the U.S. with very dry conditions across the Pacific Northwest and very wet conditions across the southwestern portion of the country (Figure 6). The 500 hPa height pattern for November showed a strong trough dominating the eastern U.S. (Figure 7), bringing the cold and dry conditions to our region.
-
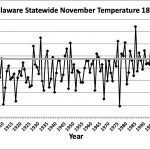
- Figure 1. Delaware statewide mean November temperature (°F) 1895-2019. Gray line indicates 1981-2010 normal.
-
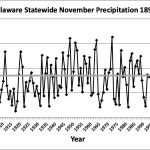
- Figure 2. Delaware statewide November precipitation (inches) 1895-2019. Gray line indicates 1981-2010 normal.
-
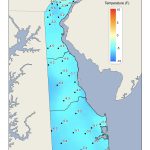
- Figure 3. November 2019 average temperature departures (°F) from the 1981-2010 mean based upon DEOS station data.
-
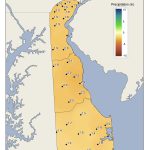
- Figure 4. November 2019 precipitation departures (inches) from the 1981-2010 mean based upon DEOS station data. Figure 5. National daily mean temperature anomalies for November 2019 (from the PRISM Climate Group, OSU).
-
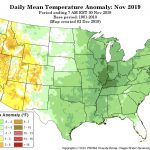
- Figure 5. National daily mean temperature anomalies for November 2019 (from the PRISM Climate Group, OSU).
-
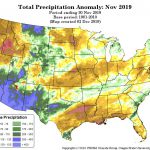
- Figure 6. Total Precipitation Anomaly for November 2019 (from the PRISM Climate Group, OSU).
-
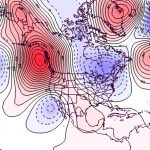
- Figure 7. 500 hPa geopotential height anomalies for November 2019. Negative (blue) anomalies indicate the presence of an anomalous jet stream trough while positive (red) height anomalies indicate the presence of anomalous ridging.
Similar Posts
- November 2025 – Cool and Very Dry Across Delaware (2025)
- November 2024 – Very Warm and Dry Across Delaware (2024)
- November 2023 – Cool and Dry Across Delaware (2023)
- November 2022 – Warm with Near Normal Precipitation Across Delaware (2022)
- November 2021 – Below Normal Temperatures and Precipitation Across Delaware (2021)
Climate Office Partners


