September Temperatures
Preliminary data indicates that the statewide average temperature in September was 70.4°F, which was 1.3°F above the 1991-2020 mean value of 69.1°F (Figure 1). This September’s temperature was the 21st warmest since observations began in 1895.
September Precipitation
Delaware’s statewide precipitation for September 2023 averaged 5.97 inches, 1.75 inches above the 1991-2020 mean of 4.22 inches (Figure 2). This month’s statewide precipitation total was the 14th wettest September since observations began in 1895.
Statewide Spatial Anomalies
Data from the Delaware Environmental Observing System (DEOS) show that temperature departures were primarily positive across the state, but generally small except in the Wilmington area (Figure 3). Precipitation was above normal across most of the state, with some locations seeing positive anomalies of greater than five inches (Figure 4).
National Anomalies
Temperatures were generally above normal across the central portion of the country, and New England. Positive temperature anomalies were up to 6°F across portions of Texas. The far western U.S. experienced below normal temperatures (Figure 5). Negative precipitation departures covered most of the eastern U.S. except for the Mid-Atlantic region and southern New England where precipitation was above normal (Figure 6). The 500 hPa height pattern for September shows a jet stream trough covering the Pacific Coast of the U.S. and a jet stream ridge covering much of the central portion of the country. These two features were responsible for the temperature anomalies in both locations. (Figure 7).
-
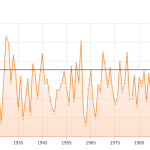
- Figure 1. Delaware statewide mean September temperature (degrees F) 1895-2023. Black line indicates 1991-2020 normal (NOAA, NCEI, Climate at a Glance: Statewide Time Series).
-
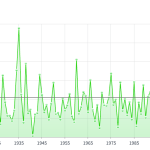
- Figure 2. Delaware statewide September precipitation (inches) 1895-2023. Black line indicates 1991-2020 normal (NOAA, NCEI, Climate at a Glance: Statewide Time Series).
-
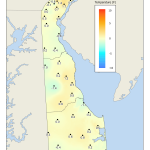
- Figure 3. Delaware statewide September precipitation (inches) 1895-2023 (degrees F) from the 1991-2020 mean based upon DEOS station data.
-
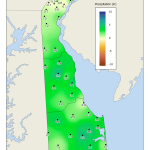
- Figure 4. September 2023 precipitation departures (inches) from the 1991-2020 mean based upon DEOS station data.
-
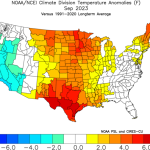
- Figure 5. NOAA/NCEI climate division temperature anomalies (degrees F) for September 2023 (from NOAA Physical Sciences Laboratory).
-
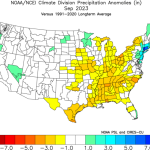
- Figure 6. NOAA/NCEI climate division precipitation anomalies (inches) for September 2023 (from NOAA Physical Sciences Laboratory).
-
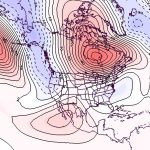
- Figure 7. 500 hPa geopotential height anomalies for September 2023. Negative (blue) anomalies indicate the presence of an anomalous jet stream trough while positive (red) height anomalies indicate the presence of an anomalous jet stream ridge.
Similar Posts
- September 2025 – Warm with Below Normal Precipitation Across Delaware (2025)
- September 2024 – Very Dry with Near Normal Temperatures (2024)
- September 2022 – Near Normal Temperatures and Dry Conditions Across Delaware (2022)
- September 2021 – Warm with Near Normal Precipitation Across Delaware (2021)
- September 2020 – Near Normal Temperature and Precipitation Across Delaware (2020)
Climate Office Partners


