April Temperatures
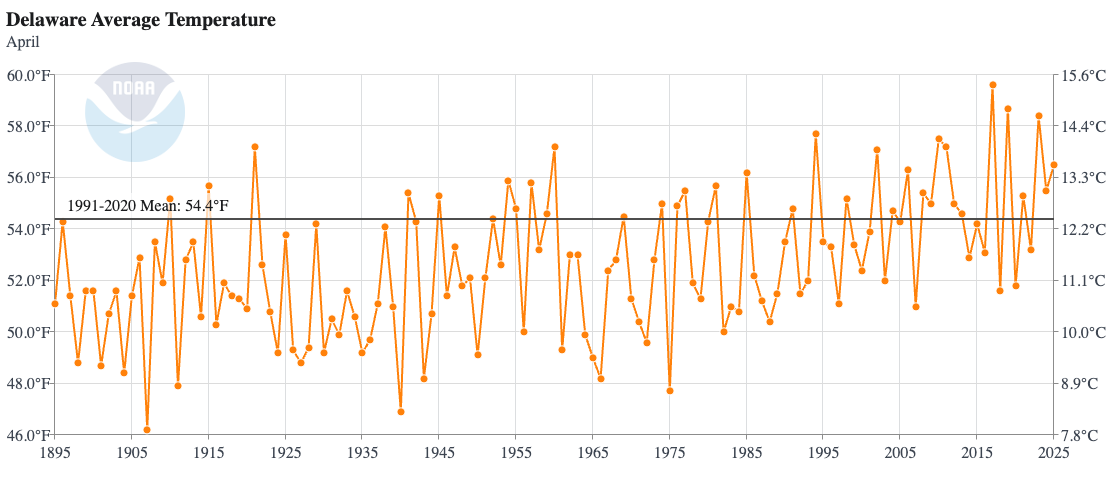
Preliminary data indicates that the statewide average temperature in April was 56.2o F, which is 1.8o F above the 1991-2020 mean value of 54.4o F (Figure 1). April 2025 was tied with April of 1985 as the 11th warmest April on record since 1895.
April Precipitation
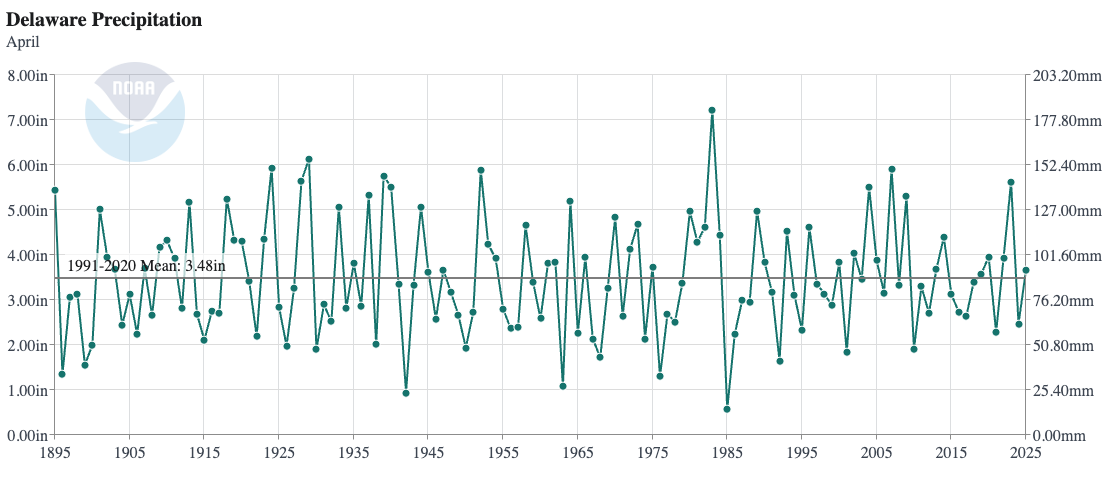
Delaware’s statewide precipitation for April 2025 averaged 3.63 inches, 0.15 inches above the 1991-2020 mean of 3.48 inches (Figure 2). April 2025 precipitation was in the “normal” range of all April precipitation totals since 1895.
Statewide Spatial Anomalies
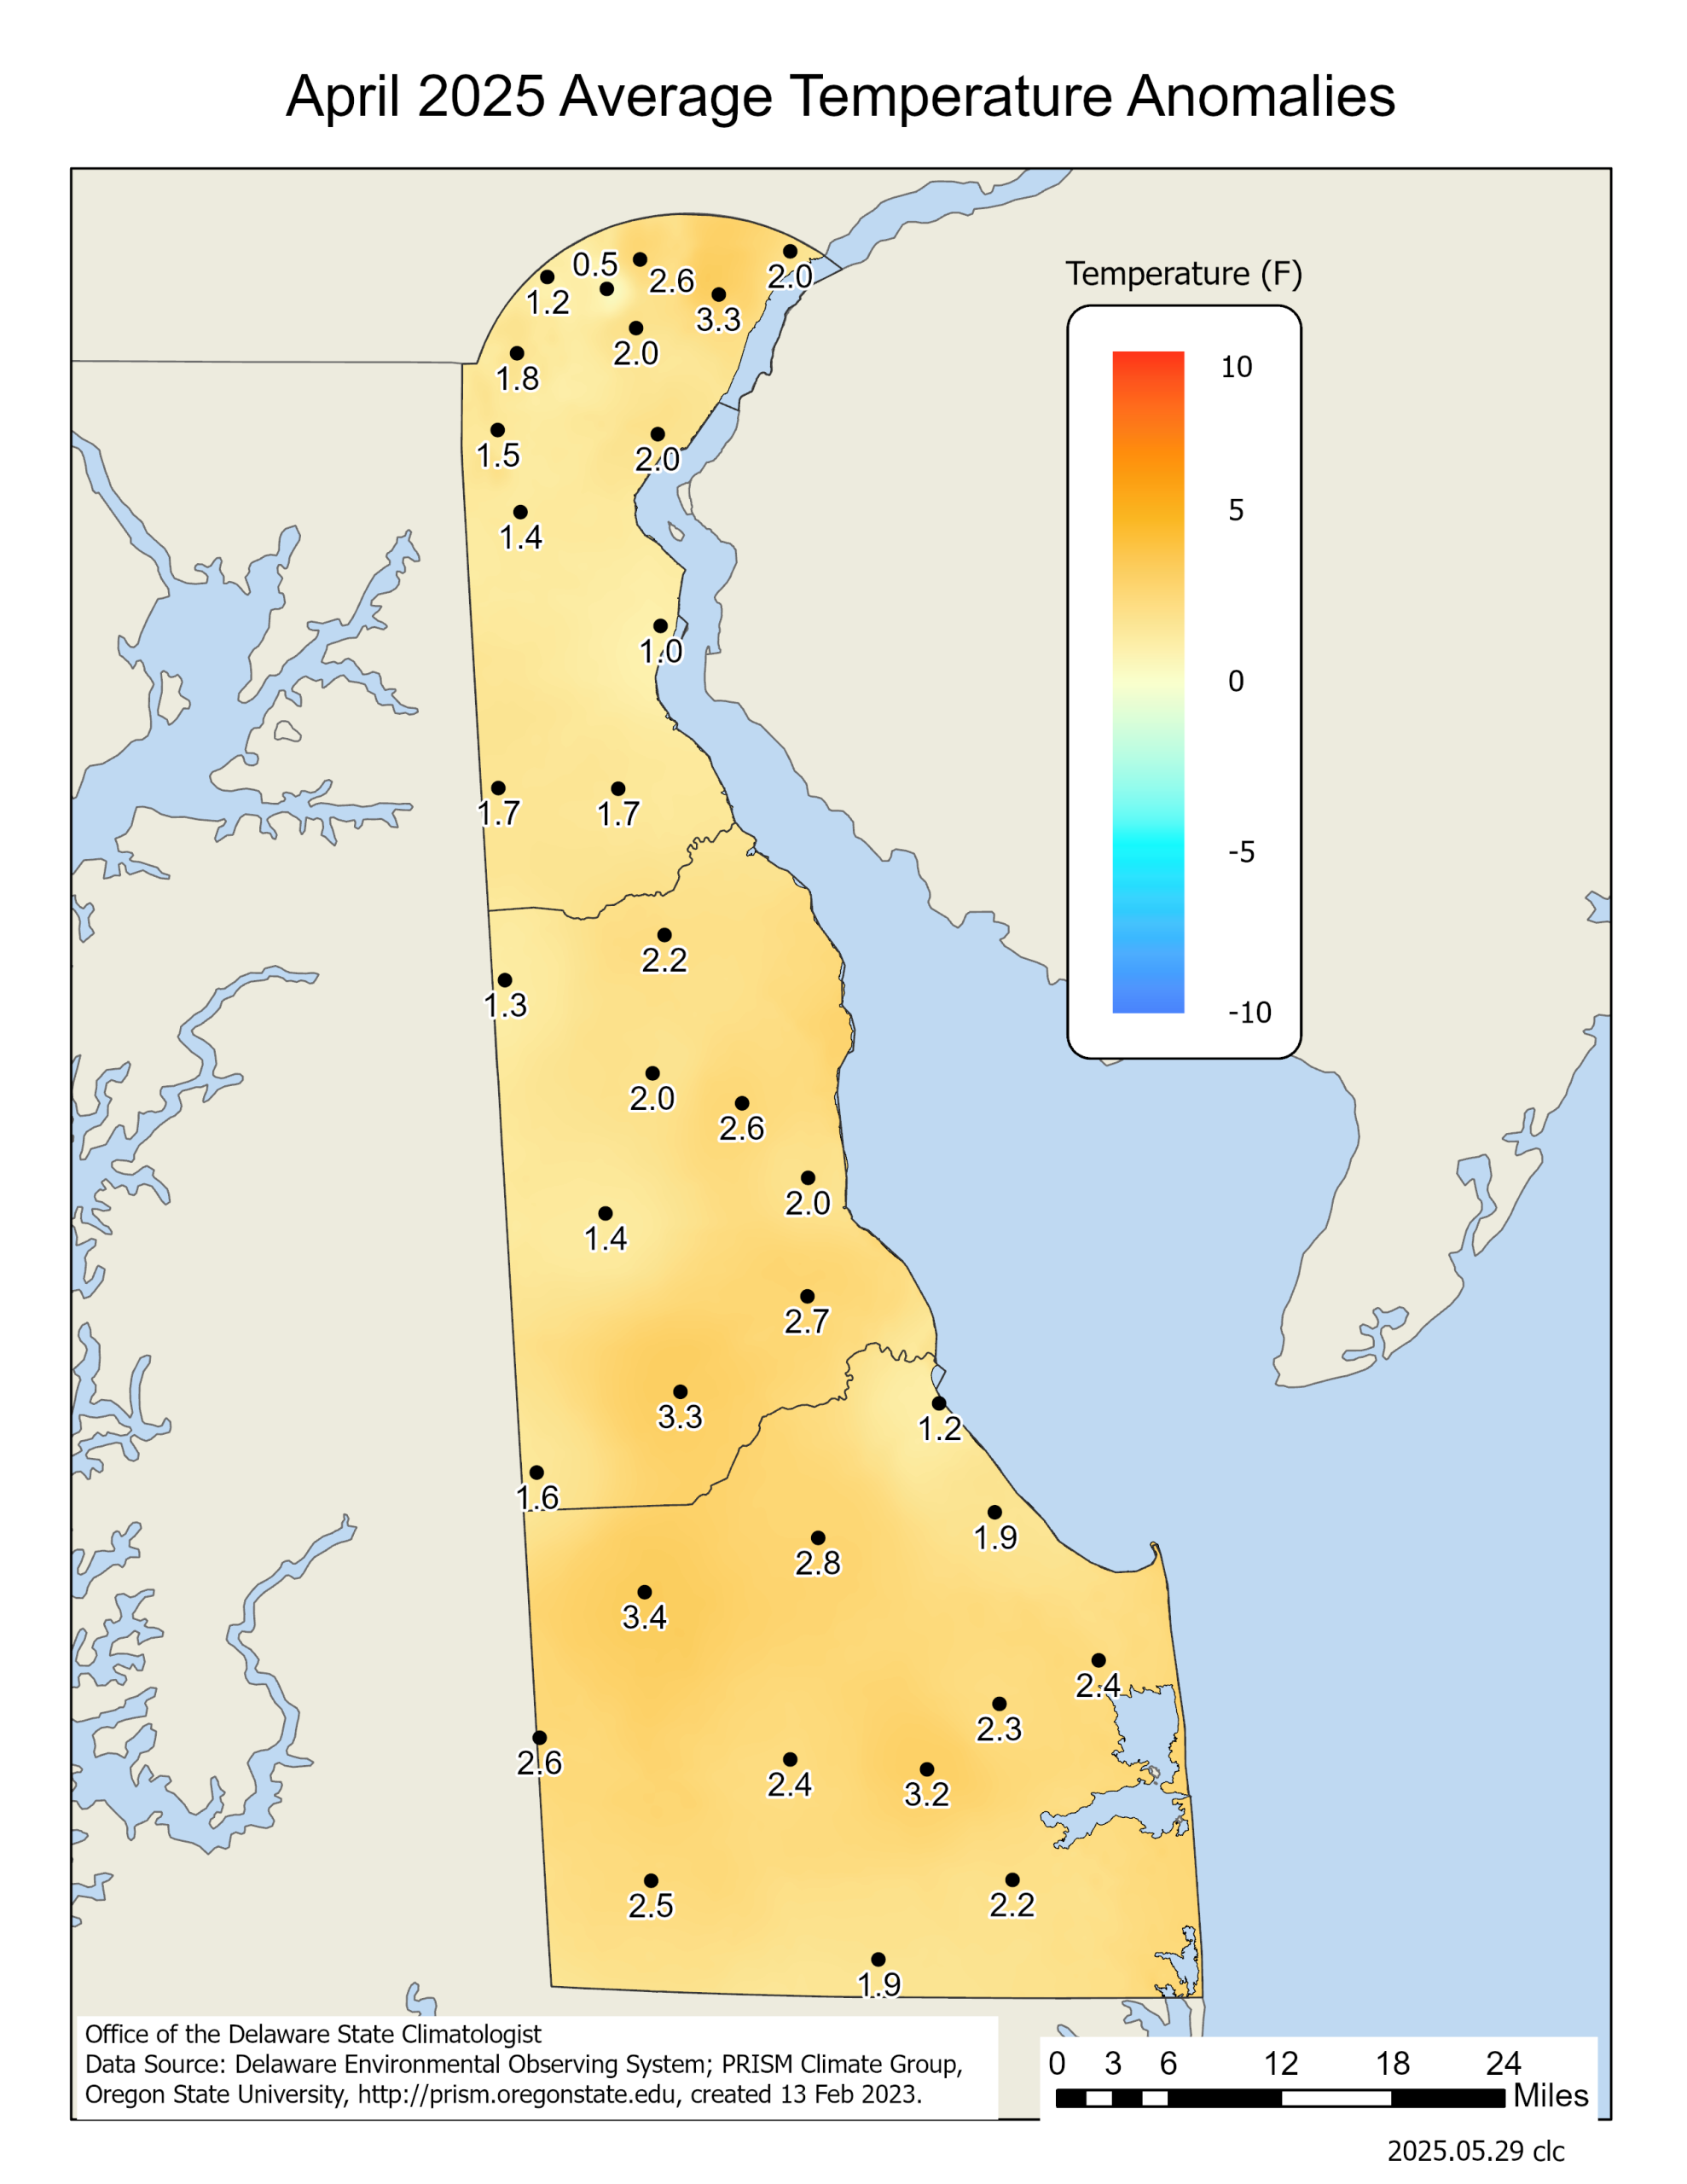
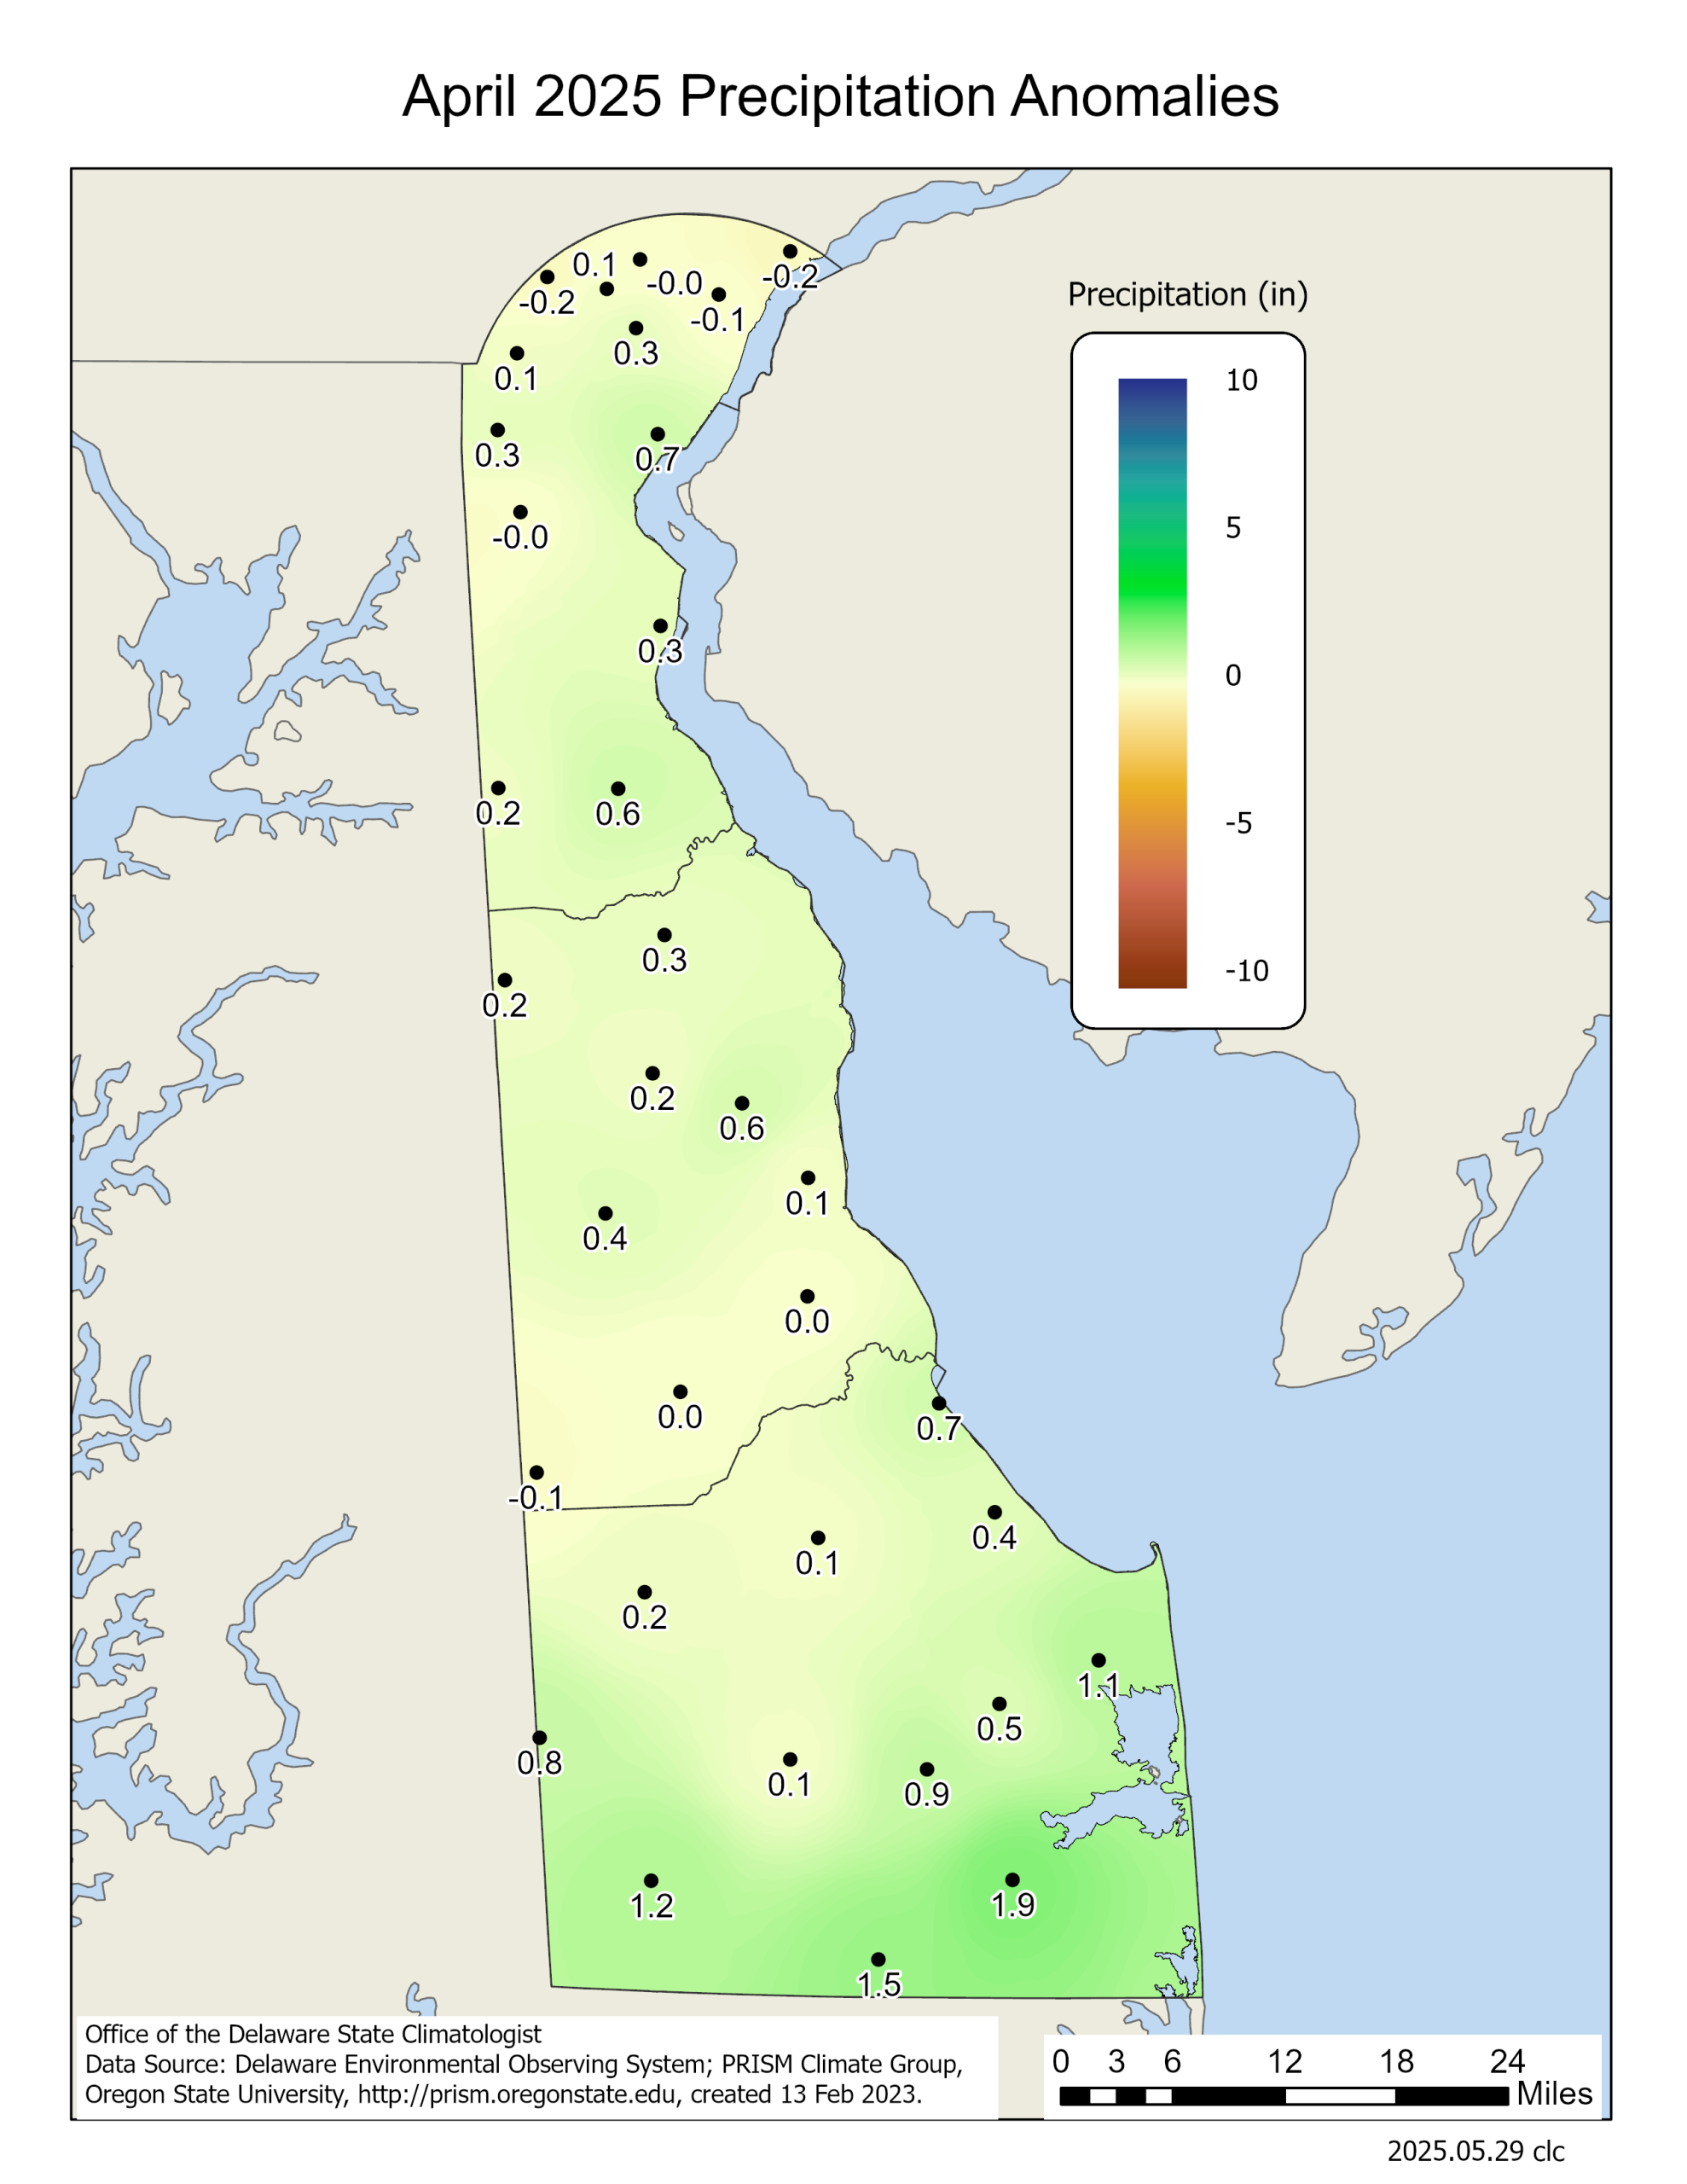
Data from the Delaware Environmental Observing System (DEOS) show that temperature departures were uniformly positive across the entire State (Figure 3), with some stations reaching anomalies of over 3o F in both Kent and Sussex Counties. Precipitation was near normal across the state with the largest positive anomalies found across southern Sussex County (Figure 4).
National Anomalies
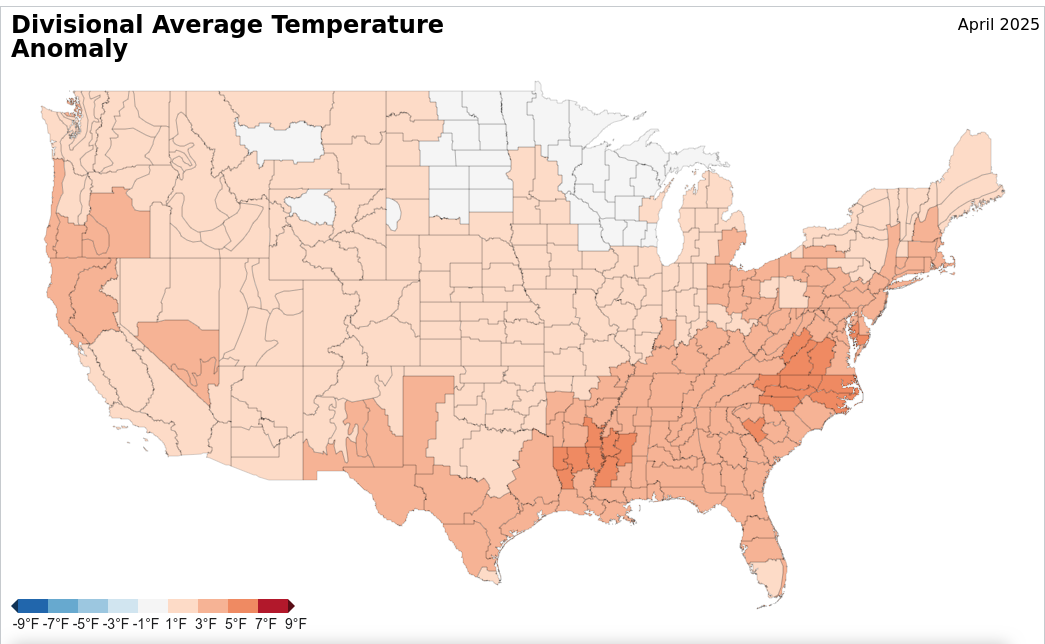
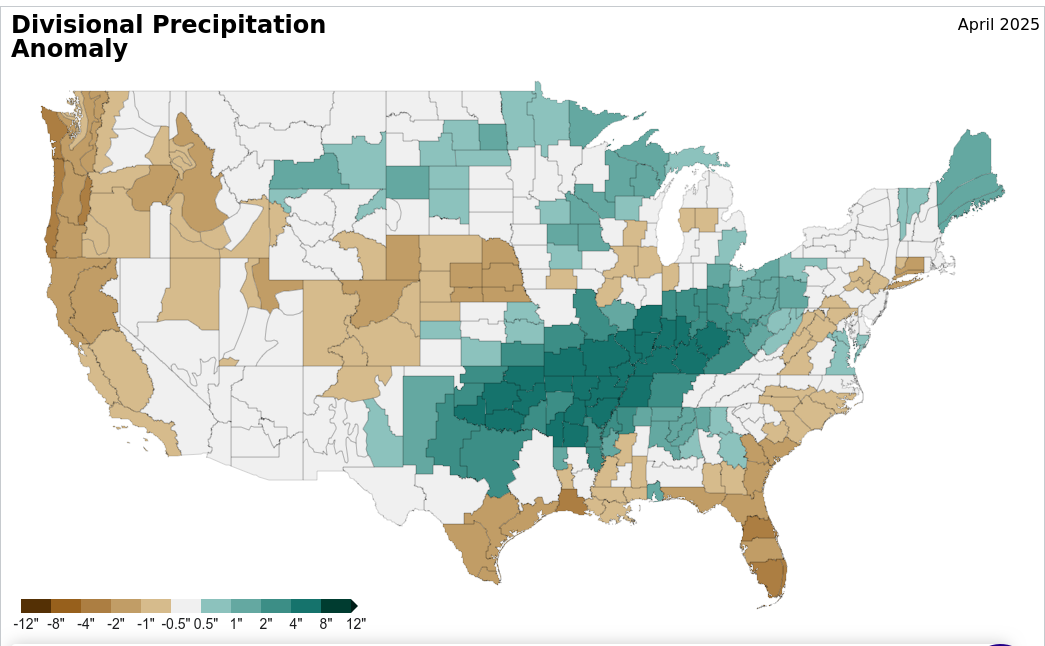
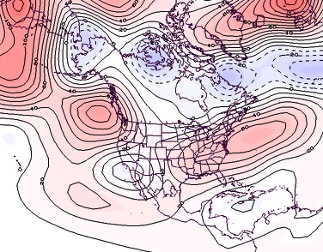
Temperatures were above normal across the entire United States, except for the north-central portions of the country where temperatures were near normal (Figure 5). Large temperature anomalies of 5o to 7o F were found across parts of the Southeast. Precipitation varied across the country (Figure 6) with much of the central portions of the country seeing large positive precipitation anomalies of over 4 inches. The 500 hPa height pattern for April showed an anomalous jet stream ridge across much of the eastern United States and the Pacific Northwest associated with the warm temperatures in these regions (Figure 7).
Global Anomalies
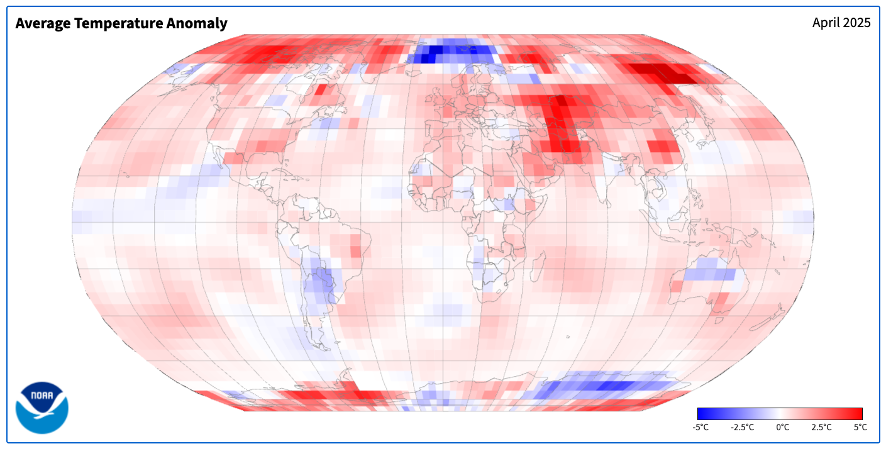
April 2025 ranked as the second warmest April on record for the globe since 1850. Global temperatures were 2.20o F (1.22o C) above the 1901-2000 mean. Particular warmth was found across central and far eastern Asia (Figure 8).
-
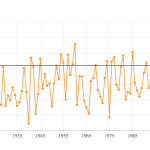
- Figure 1. Delaware statewide mean April temperature (degrees F) 1895-2025. The black line indicates the 1991-2020 normal (NOAA, NCEI, Climate at a Glance: Statewide Time Series).
-
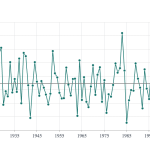
- Figure 2. Delaware statewide April precipitation (inches) 1895-2025. The Black line indicates the 1991-2020 normal (NOAA, NCEI, Climate at a Glance: Statewide Time Series).
-
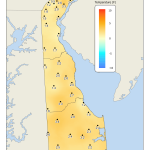
- Figure 3. April 2025 average temperature departures (degrees F) from the 1991-2020 mean based upon DEOS station data.
-
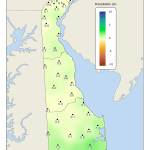
- Figure 4. April 2025 precipitation departures (inches) from the 1991-2020 mean based upon DEOS station data.
-
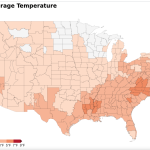
- Figure 5. United States climate division temperature anomalies (degrees F) for April 2025 (NOAA, NCEI, Climate at a Glance: Divisional Mapping).
-
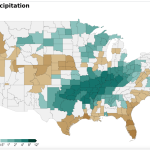
- Figure 6. United States climate division precipitation anomalies (inches) for April 2025 (NOAA, NCEI, Climate at a Glance: Divisional Mapping).
-
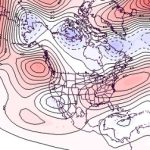
- Figure 7. 500 hPa geopotential height anomalies for April 2025. Negative (blue) anomalies indicate the presence of an anomalous jet stream trough while positive (red) height anomalies indicate the presence of an anomalous jet stream ridge.
-
- Figure 8. Global temperature anomalies (degrees C) for April 2025 (NOAA, NCEI, Climate at a Glance: Global Mapping).
Similar Posts
- April 2026 – Very Warm and Dry Across Delaware (2026)
- April 2024 – Warm and Dry Across Delaware (2024)
- April 2023 – Very Warm with Above Normal Precipitation Across Delaware (2023)
- April 2022 – Cool and Wet Conditions Prevail Across Delaware (2022)
- April 2021 – Warm with Below Normal Precipitation Across Delaware (2021)
Climate Office Partners


