Delaware’s 2013 climate was characterized by slightly warmer than normal temperatures and above normal precipitation values.
Annual Temperature
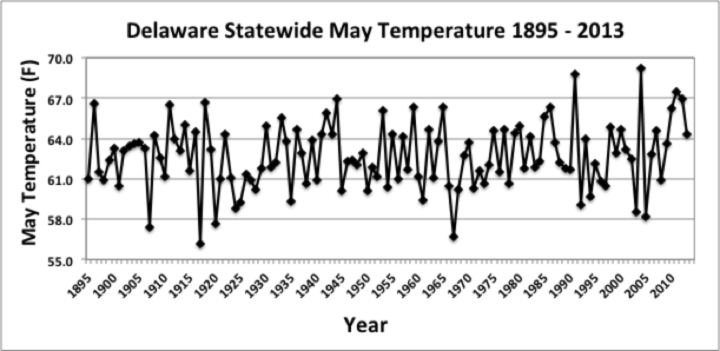
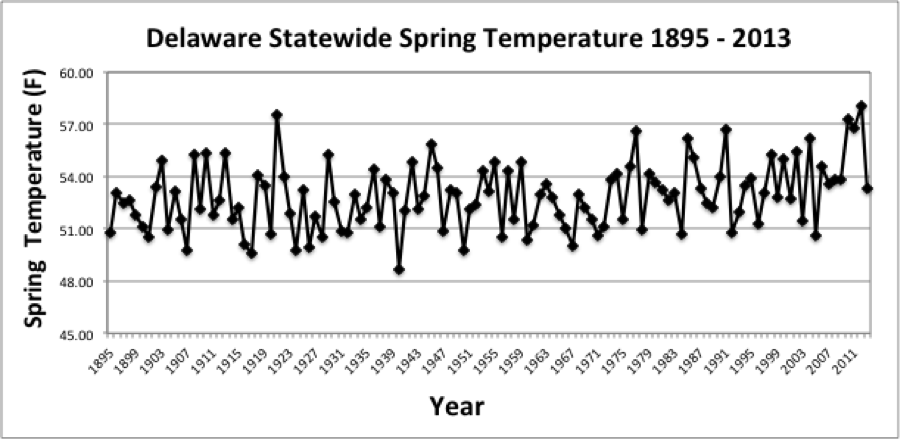
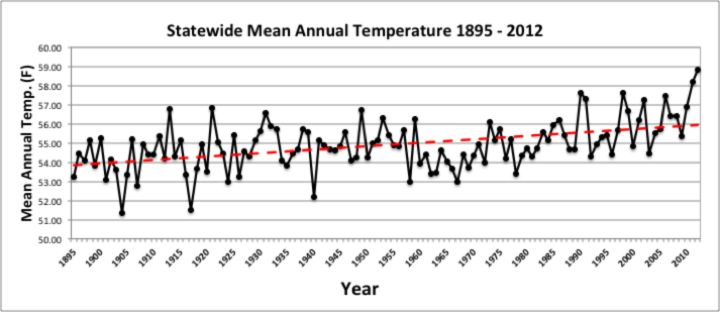
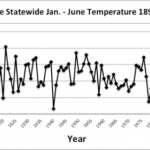
Statewide mean annual temperature in 2013 was 56.5°F according to preliminary data from the National Climatic Data Center (NCDC). This was 0.7°F above the 1981-2010 normal of 55.8°F (Figure 1) and was the fourth year in a row with above normal temperatures. However, this year was nearly 2.0°F cooler than 2012’s all time high value of 58.4°F.
Annual Precipitation
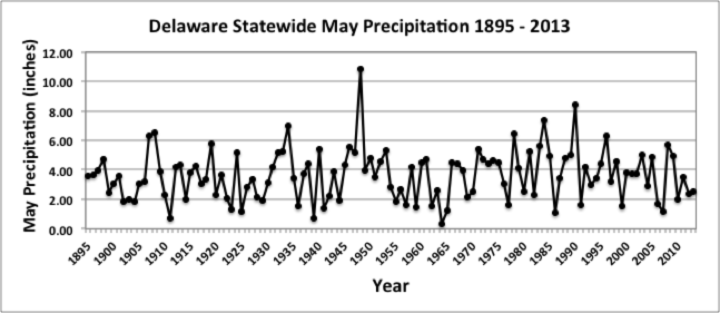
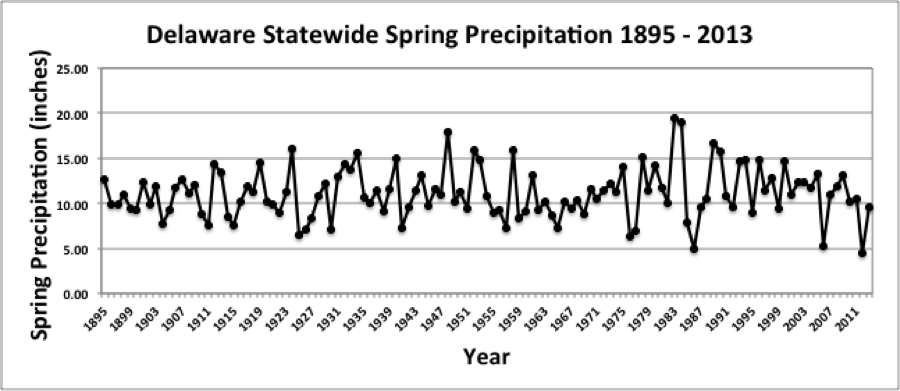
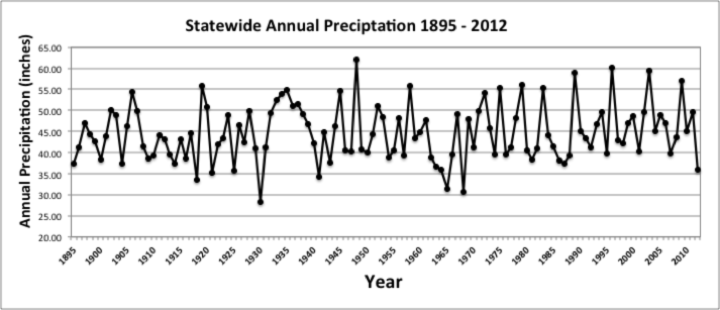
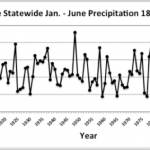
Statewide precipitation in 2013 averaged 49.93 inches, 4.07 inches above the 1981-2010 mean of 45.86 inches (Figure 2). Most areas of the state saw substantially above normal precipitation during the summer months, making the summer of 2013 the 5th wettest on record since 1895.
Statewide Spatial Averages
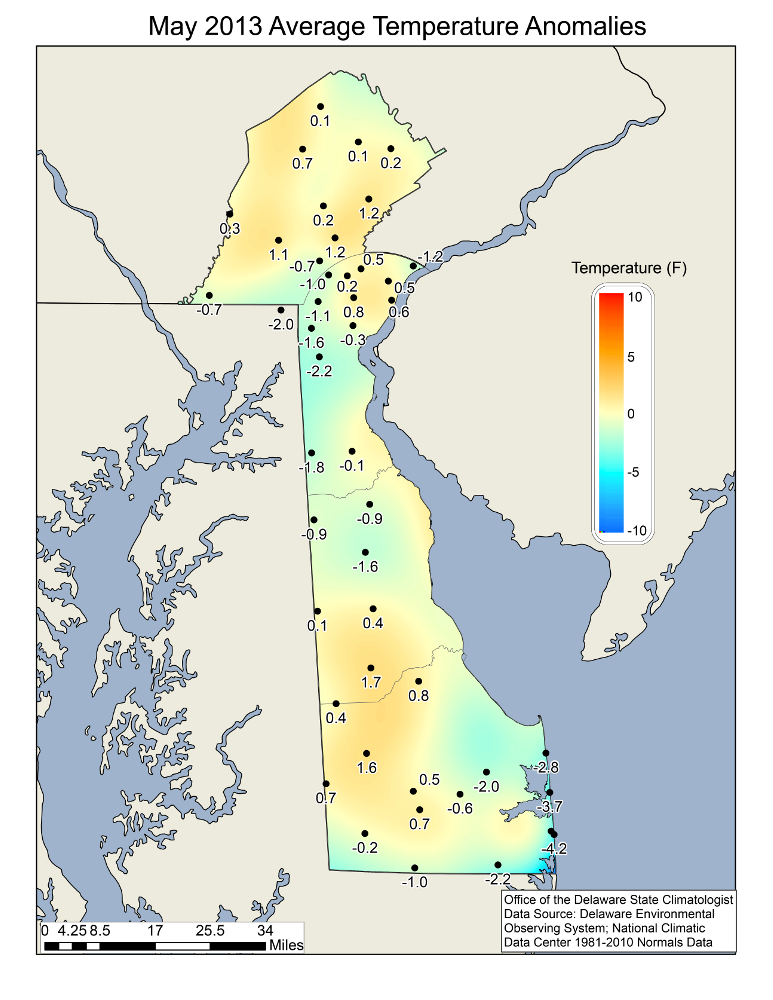
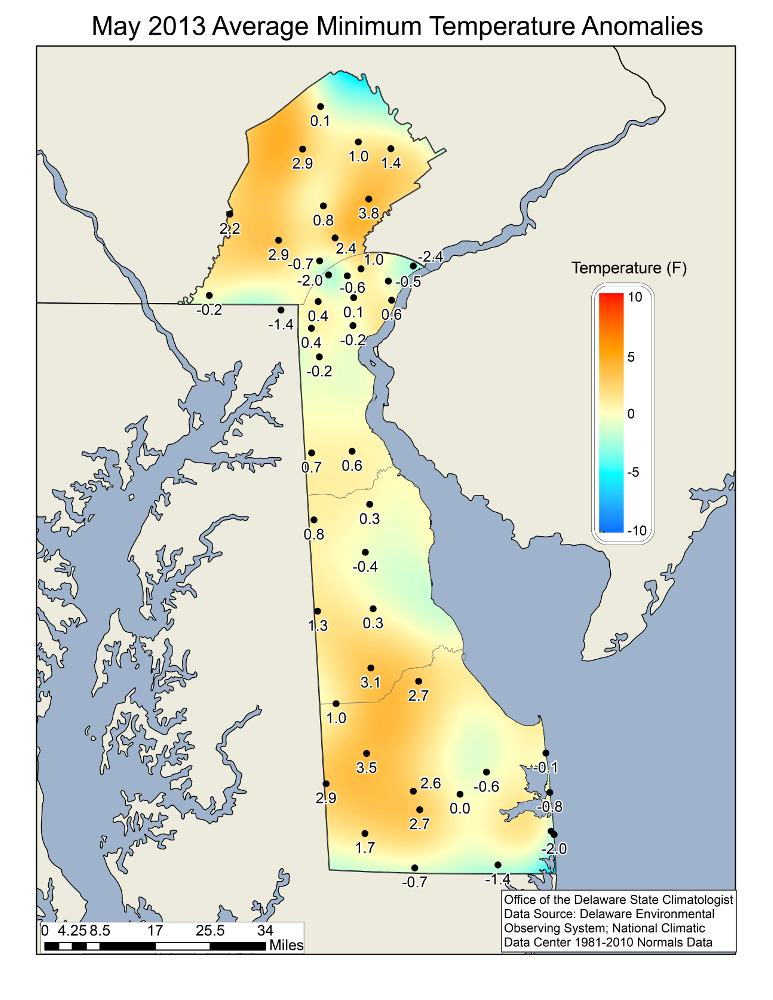
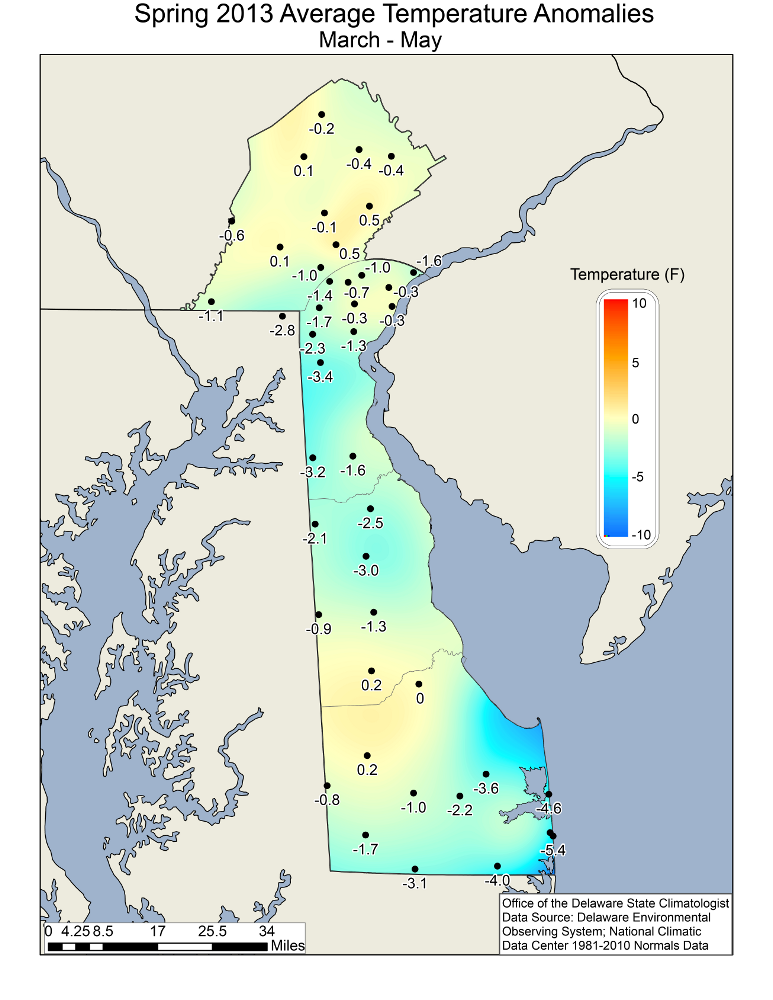
According to data from the Delaware Environmental Observing System (DEOS; deos.udel.edu), mean annual temperatures were above normal across portions of New Castle, western Kent and Sussex counties, and across Chester County, PA (Figure 3). Mean annual temperatures were below normal across the remainder of the State.
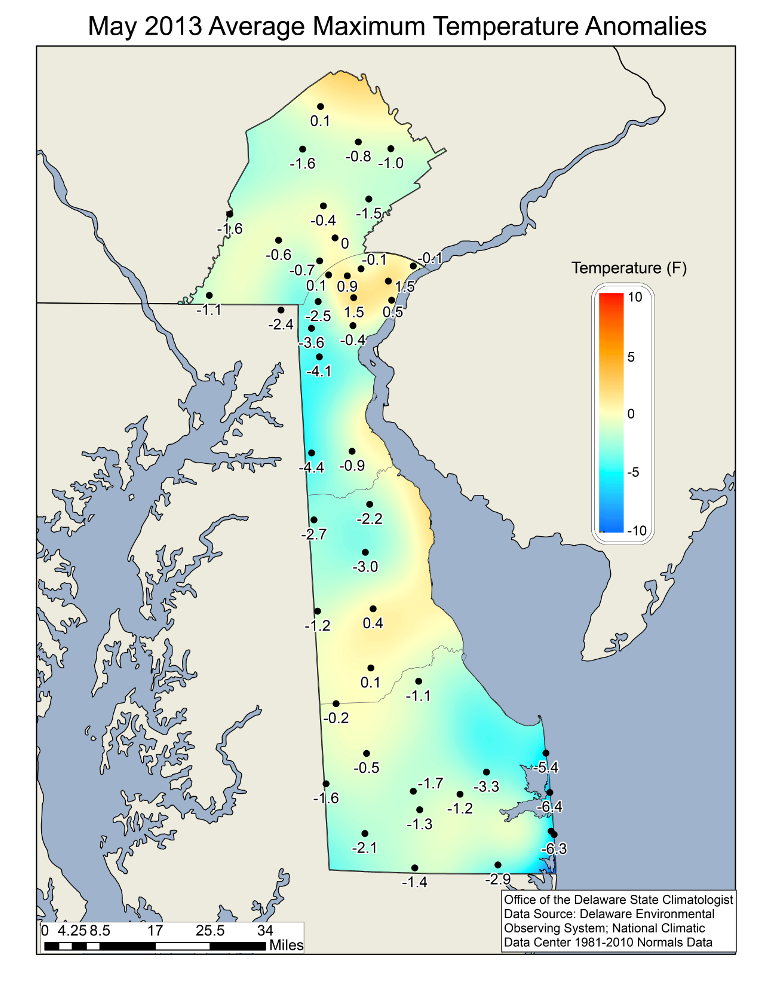
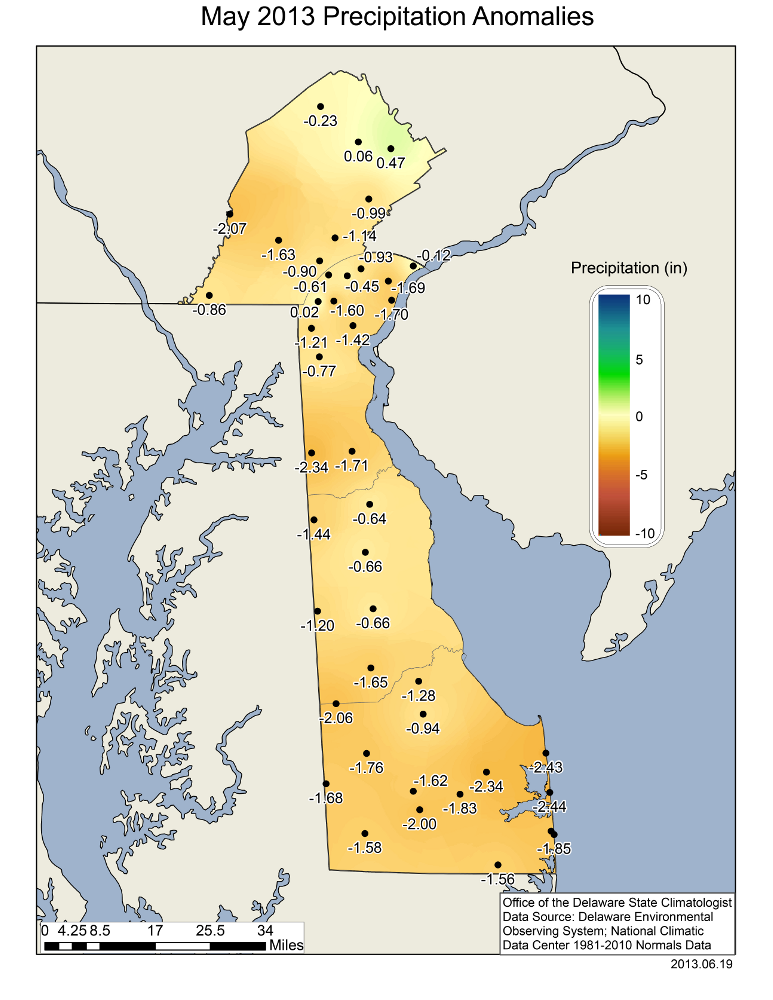
Precipitation was much above normal in all locations except southwestern Kent County and portions of Chester County, PA (Figure 4). The largest positive precipitation departures were found along the eastern portions of Sussex County where some locations received 10 inches more precipitation than normal.
-
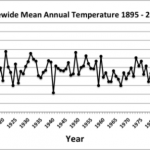
- Figure 1. Delaware statewide mean annual temperature (°F) 1895-2013.
-
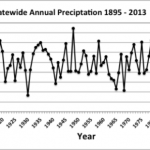
- Figure 2. Delaware statewide mean annual precipitation (inches) 1895-2013.
-
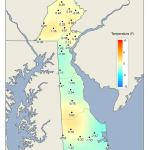
- Figure 3. 2013 mean annual temperature departures from the 1981-2010 mean based upon DEOS station data.
-
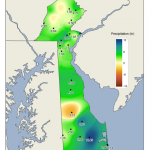
- Figure 4. 2013 annual precipitation departures from the 1981-2010 mean based upon DEOS station data.